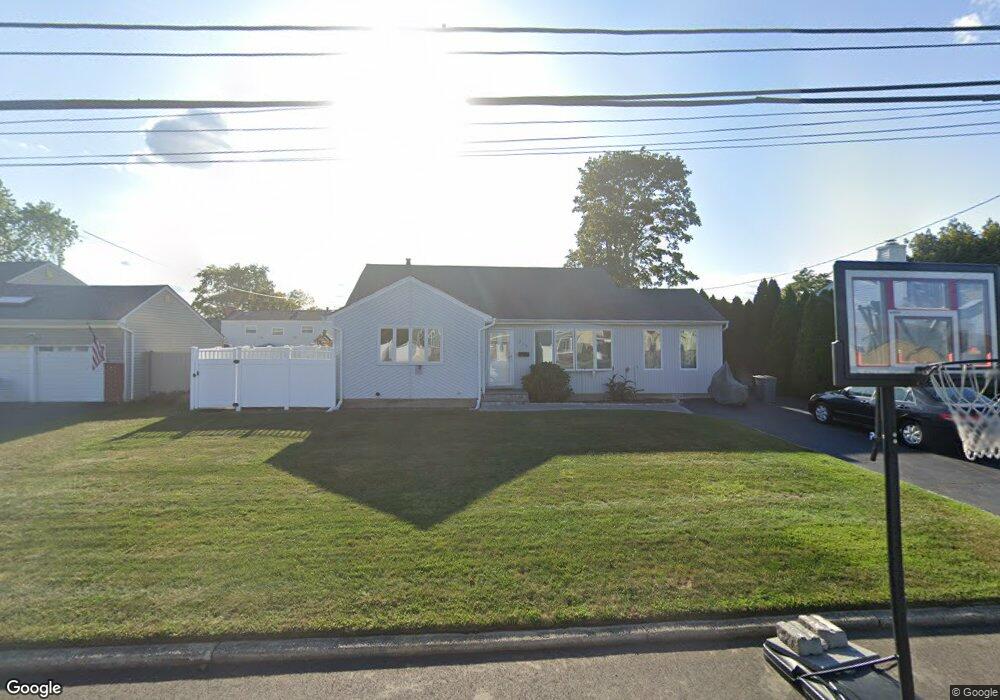
258 E 4th St Deer Park, NY 11729
Estimated Value: $657,368 - $696,000
3
Beds
2
Baths
1,681
Sq Ft
$403/Sq Ft
Est. Value
About This Home
This home is located at 258 E 4th St, Deer Park, NY 11729 and is currently estimated at $677,092, approximately $402 per square foot. 258 E 4th St is a home located in Suffolk County with nearby schools including Robert Frost Middle School, Deer Park High School, and Hebrew School of Dix Hills.
Ownership History
Date
Name
Owned For
Owner Type
Purchase Details
Closed on
Feb 27, 2017
Sold by
Devine John P
Bought by
Michel Daniel
Current Estimated Value
Home Financials for this Owner
Home Financials are based on the most recent Mortgage that was taken out on this home.
Original Mortgage
$334,248
Outstanding Balance
$272,837
Interest Rate
3.62%
Mortgage Type
FHA
Estimated Equity
$404,255
Purchase Details
Closed on
May 11, 2009
Sold by
Zambrano Eduardo Christine
Bought by
Devine John P
Home Financials for this Owner
Home Financials are based on the most recent Mortgage that was taken out on this home.
Original Mortgage
$225,000
Interest Rate
4.93%
Purchase Details
Closed on
Mar 6, 2000
Sold by
Dejoseph Frank
Bought by
Zambrano Eduardo and Zambrano Christine
Home Financials for this Owner
Home Financials are based on the most recent Mortgage that was taken out on this home.
Original Mortgage
$208,550
Interest Rate
8.18%
Create a Home Valuation Report for This Property
The Home Valuation Report is an in-depth analysis detailing your home's value as well as a comparison with similar homes in the area
Home Values in the Area
Average Home Value in this Area
Purchase History
| Date | Buyer | Sale Price | Title Company |
|---|---|---|---|
| Michel Daniel | $365,000 | None Available | |
| Devine John P | $325,000 | Gary Schder | |
| Zambrano Eduardo | $215,000 | -- |
Source: Public Records
Mortgage History
| Date | Status | Borrower | Loan Amount |
|---|---|---|---|
| Open | Michel Daniel | $334,248 | |
| Previous Owner | Devine John P | $225,000 | |
| Previous Owner | Zambrano Eduardo | $208,550 |
Source: Public Records
Tax History
| Year | Tax Paid | Tax Assessment Tax Assessment Total Assessment is a certain percentage of the fair market value that is determined by local assessors to be the total taxable value of land and additions on the property. | Land | Improvement |
|---|---|---|---|---|
| 2022 | $10,739 | $3,645 | $340 | $3,305 |
| 2021 | $10,739 | $3,645 | $340 | $3,305 |
| 2020 | $11,430 | $3,645 | $340 | $3,305 |
| 2019 | $11,430 | $0 | $0 | $0 |
Source: Public Records
Map
Nearby Homes
Your Personal Tour Guide
Ask me questions while you tour the home.