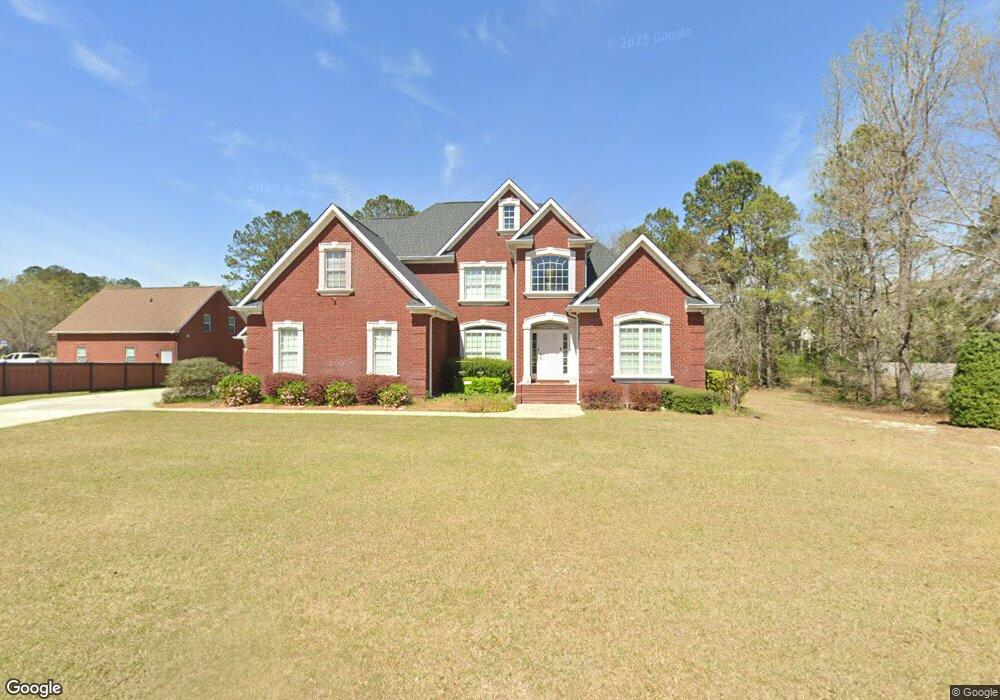
258 Falcon Crest Warner Robins, GA 31088
Estimated Value: $462,000 - $512,000
4
Beds
3
Baths
2,965
Sq Ft
$163/Sq Ft
Est. Value
About This Home
This home is located at 258 Falcon Crest, Warner Robins, GA 31088 and is currently estimated at $484,709, approximately $163 per square foot. 258 Falcon Crest is a home located in Houston County with nearby schools including Bonaire Elementary School, Huntington Middle School, and Warner Robins High School.
Ownership History
Date
Name
Owned For
Owner Type
Purchase Details
Closed on
Jun 28, 2019
Sold by
Terry Craig W and Terry Carolyn H
Bought by
Grider Sheneika and Grider Sheneika W
Current Estimated Value
Home Financials for this Owner
Home Financials are based on the most recent Mortgage that was taken out on this home.
Original Mortgage
$335,000
Outstanding Balance
$293,369
Interest Rate
3.8%
Mortgage Type
VA
Estimated Equity
$191,340
Purchase Details
Closed on
Nov 15, 2006
Sold by
Stathams Landing Company
Bought by
Terry Craig W
Purchase Details
Closed on
Aug 25, 2006
Sold by
Hollomon Homes Inc
Bought by
Statham'S Landing Co
Purchase Details
Closed on
May 12, 2004
Sold by
Stathams Landing Co
Bought by
Hollomon Homes Inc
Create a Home Valuation Report for This Property
The Home Valuation Report is an in-depth analysis detailing your home's value as well as a comparison with similar homes in the area
Home Values in the Area
Average Home Value in this Area
Purchase History
| Date | Buyer | Sale Price | Title Company |
|---|---|---|---|
| Grider Sheneika | $335,000 | None Available | |
| Terry Craig W | $63,000 | None Available | |
| Statham'S Landing Co | $69,900 | -- | |
| Hollomon Homes Inc | $55,000 | -- |
Source: Public Records
Mortgage History
| Date | Status | Borrower | Loan Amount |
|---|---|---|---|
| Open | Grider Sheneika | $335,000 |
Source: Public Records
Tax History Compared to Growth
Tax History
| Year | Tax Paid | Tax Assessment Tax Assessment Total Assessment is a certain percentage of the fair market value that is determined by local assessors to be the total taxable value of land and additions on the property. | Land | Improvement |
|---|---|---|---|---|
| 2024 | $1,598 | $183,800 | $23,200 | $160,600 |
| 2023 | $1,149 | $157,520 | $20,880 | $136,640 |
| 2022 | $1,053 | $145,320 | $20,880 | $124,440 |
| 2021 | $783 | $133,120 | $20,880 | $112,240 |
| 2020 | $3,223 | $132,040 | $20,880 | $111,160 |
| 2019 | $2,813 | $115,240 | $20,880 | $94,360 |
| 2018 | $2,813 | $115,240 | $20,880 | $94,360 |
| 2017 | $2,816 | $115,240 | $20,880 | $94,360 |
| 2016 | $2,820 | $115,240 | $20,880 | $94,360 |
| 2015 | $2,826 | $115,240 | $20,880 | $94,360 |
| 2014 | -- | $120,320 | $20,880 | $99,440 |
| 2013 | -- | $120,320 | $20,880 | $99,440 |
Source: Public Records
Map
Nearby Homes
- 412 Stathams Way
- 414 Stathams Way
- 503 Heathwood Place
- 0 Heathwood Place Unit 221912
- 0 Heathwood Place Unit 8204934
- 0 Heathwood Place Unit 7309441
- 501 Heathwood Place
- 416 Stathams Way
- 259 Falcon Crest
- 255 Falcon Crest Unit 10B
- 255 Falcon Crest
- 255 Falcon Crest
- 257 Falcon Crest
- 261 Falcon Crest
- 502 Heathwood Place
- 411 Stathams Way
- 410 Stathams Way
- 409 Stathams Way
- 500 Heathwood Place
- 413 Stathams Way