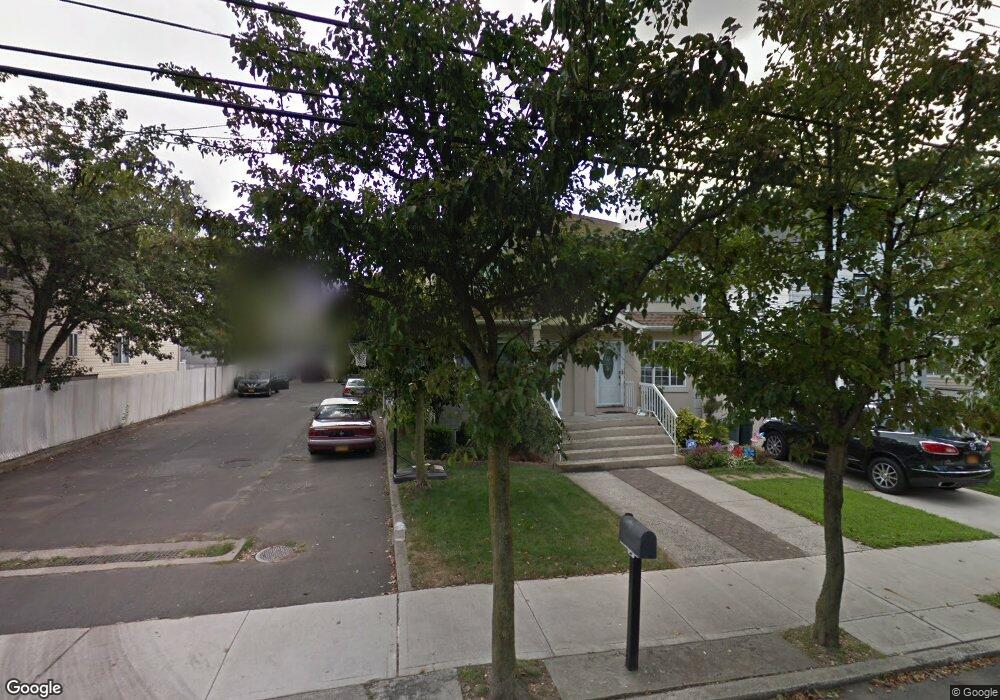
258 Fisher Ave Staten Island, NY 10307
Tottenville NeighborhoodEstimated Value: $445,000 - $770,000
3
Beds
2
Baths
2,016
Sq Ft
$329/Sq Ft
Est. Value
About This Home
This home is located at 258 Fisher Ave, Staten Island, NY 10307 and is currently estimated at $662,357, approximately $328 per square foot. 258 Fisher Ave is a home located in Richmond County with nearby schools including P.S. 1 Tottenville, Is 34 Tottenville, and Tottenville High School.
Ownership History
Date
Name
Owned For
Owner Type
Purchase Details
Closed on
Jun 12, 2014
Sold by
Lee Han Kuk and Lee Soo Ki
Bought by
Lee Han Kuk and Lee Soo Ki
Current Estimated Value
Home Financials for this Owner
Home Financials are based on the most recent Mortgage that was taken out on this home.
Original Mortgage
$203,707
Outstanding Balance
$63,363
Interest Rate
4.16%
Mortgage Type
New Conventional
Estimated Equity
$598,994
Purchase Details
Closed on
Mar 20, 1996
Sold by
Joseph Court Building Corp
Bought by
Lee Han Kuk and Lee Soo Ki
Create a Home Valuation Report for This Property
The Home Valuation Report is an in-depth analysis detailing your home's value as well as a comparison with similar homes in the area
Home Values in the Area
Average Home Value in this Area
Purchase History
| Date | Buyer | Sale Price | Title Company |
|---|---|---|---|
| Lee Han Kuk | -- | The Judicial Title Insurance | |
| Lee Han Kuk | $189,000 | Chicago Title Insurance Co |
Source: Public Records
Mortgage History
| Date | Status | Borrower | Loan Amount |
|---|---|---|---|
| Open | Lee Han Kuk | $203,707 |
Source: Public Records
Tax History Compared to Growth
Tax History
| Year | Tax Paid | Tax Assessment Tax Assessment Total Assessment is a certain percentage of the fair market value that is determined by local assessors to be the total taxable value of land and additions on the property. | Land | Improvement |
|---|---|---|---|---|
| 2025 | $5,866 | $39,420 | $7,160 | $32,260 |
| 2024 | $5,878 | $39,600 | $6,724 | $32,876 |
| 2023 | $5,579 | $28,872 | $6,193 | $22,679 |
| 2022 | $5,477 | $33,780 | $8,700 | $25,080 |
| 2021 | $5,727 | $31,980 | $8,700 | $23,280 |
| 2020 | $5,426 | $32,280 | $8,700 | $23,580 |
| 2019 | $5,042 | $32,520 | $8,700 | $23,820 |
| 2018 | $4,607 | $24,060 | $8,700 | $15,360 |
| 2017 | $4,886 | $25,440 | $8,179 | $17,261 |
| 2016 | $4,488 | $24,000 | $8,700 | $15,300 |
| 2015 | $3,925 | $26,040 | $7,260 | $18,780 |
| 2014 | $3,925 | $24,804 | $6,915 | $17,889 |
Source: Public Records
Map
Nearby Homes
- 21 Sprague Ave
- 233 Fisher Ave
- 217-219 Fisher Ave
- 7036 Amboy Rd
- 197 Craig Ave
- 140 Craig Ave
- 46 Parker St
- 7 Parker St
- 24 Sapphire Ct
- 147 Wood Ave
- 69 Nashville St
- 0 Minerva Ave Unit 495865
- 133 Fisher Ave
- 27 Honey Ln
- 30 Paradise Place
- 5265 Arthur Kill Rd
- 90 Giegerich Ave
- 72 Giegerich Ave
- 329 George St
- 21 Kerry Ln