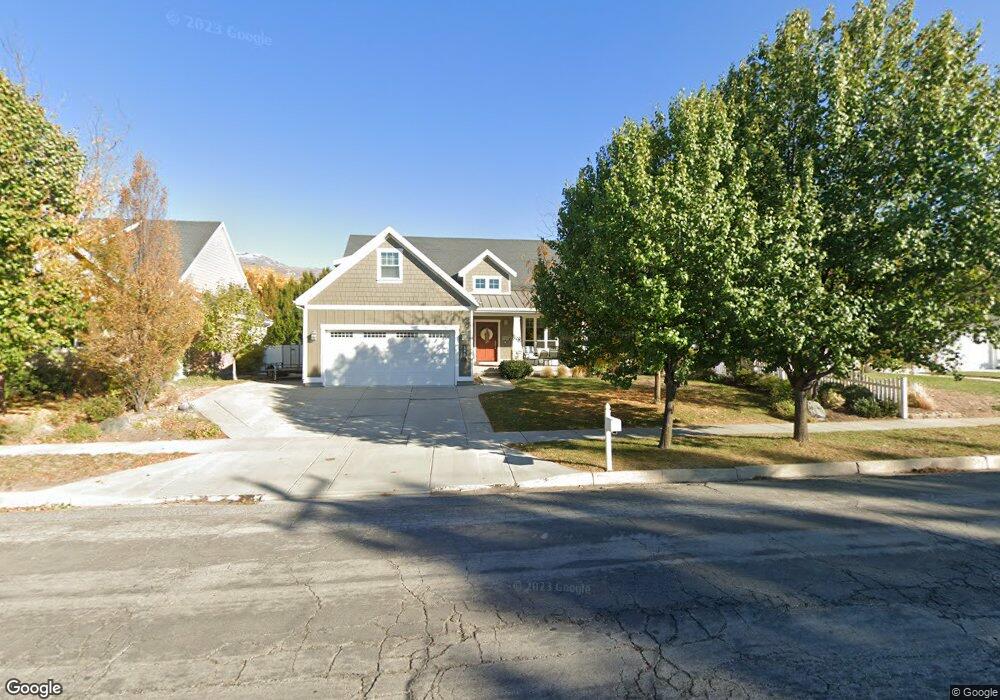
258 N 100 E Bountiful, UT 84010
Estimated Value: $908,000 - $1,063,000
3
Beds
4
Baths
5,083
Sq Ft
$191/Sq Ft
Est. Value
About This Home
This home is located at 258 N 100 E, Bountiful, UT 84010 and is currently estimated at $972,684, approximately $191 per square foot. 258 N 100 E is a home located in Davis County with nearby schools including Meadowbrook Elementary School, Bountiful Junior High School, and Bountiful High School.
Ownership History
Date
Name
Owned For
Owner Type
Purchase Details
Closed on
Jun 5, 2023
Sold by
Rock Leslie and Rock Terry
Bought by
Rock Family Trust and Rock
Current Estimated Value
Purchase Details
Closed on
May 2, 2019
Sold by
The Anne E Clegg Living Trust
Bought by
Rock Leslie and Rock Terry
Purchase Details
Closed on
May 11, 2009
Sold by
Clegg Richard R and Clegg Anne E
Bought by
Clegg Anne E
Home Financials for this Owner
Home Financials are based on the most recent Mortgage that was taken out on this home.
Original Mortgage
$250,000
Interest Rate
4.71%
Mortgage Type
Purchase Money Mortgage
Purchase Details
Closed on
May 1, 2009
Sold by
Christiansen Robert N and Christiansen Hillary
Bought by
Clegg Richard R and Clegg Anne E
Home Financials for this Owner
Home Financials are based on the most recent Mortgage that was taken out on this home.
Original Mortgage
$250,000
Interest Rate
4.71%
Mortgage Type
Purchase Money Mortgage
Create a Home Valuation Report for This Property
The Home Valuation Report is an in-depth analysis detailing your home's value as well as a comparison with similar homes in the area
Purchase History
| Date | Buyer | Sale Price | Title Company |
|---|---|---|---|
| Rock Family Trust | -- | None Listed On Document | |
| Rock Leslie | -- | Aspen Title Ins | |
| Clegg Anne E | -- | Accommodation | |
| Clegg Richard R | -- | Backman Title Services |
Source: Public Records
Mortgage History
| Date | Status | Borrower | Loan Amount |
|---|---|---|---|
| Previous Owner | Clegg Anne E | $250,000 |
Source: Public Records
Tax History
| Year | Tax Paid | Tax Assessment Tax Assessment Total Assessment is a certain percentage of the fair market value that is determined by local assessors to be the total taxable value of land and additions on the property. | Land | Improvement |
|---|---|---|---|---|
| 2025 | $5,213 | $488,950 | $138,507 | $350,443 |
| 2024 | $4,843 | $466,951 | $125,659 | $341,292 |
| 2023 | $4,831 | $820,000 | $229,443 | $590,557 |
| 2022 | $5,079 | $487,851 | $124,823 | $363,028 |
| 2021 | $4,700 | $670,000 | $163,433 | $506,567 |
| 2020 | $3,998 | $591,000 | $138,860 | $452,140 |
| 2019 | $3,698 | $532,000 | $141,657 | $390,343 |
| 2018 | $3,598 | $511,000 | $138,746 | $372,254 |
| 2016 | $3,147 | $242,165 | $59,029 | $183,136 |
| 2015 | $3,072 | $223,190 | $59,029 | $164,161 |
| 2014 | $2,904 | $216,250 | $59,029 | $157,221 |
| 2013 | -- | $220,361 | $43,945 | $176,416 |
Source: Public Records
Map
Nearby Homes
- 49 E 200 N Unit 4
- 41 E 200 N Unit 6
- 55 E 200 N Unit 2
- 51 E 200 N Unit 3
- 256 N Main St
- 254 N Main St
- 252 N Main St
- 17 E 400 N Unit 19B
- 453 N 400 E Unit 7-D
- 513 N 400 E Unit 14B
- 320 N 200 W Unit 4
- 357 S 100 E
- 332 N 300 W
- 499 N 200 W Unit 30
- 499 N 200 W Unit 19
- 255 E 400 S
- 32 W 400 S
- 75 N Peregrine Ln W Unit 8
- 34 W 400 S
- 978 N 170 E
Your Personal Tour Guide
Ask me questions while you tour the home.