258 N 400 W Clearfield, UT 84015
Estimated Value: $344,000 - $397,000
2
Beds
1
Bath
1,296
Sq Ft
$291/Sq Ft
Est. Value
About This Home
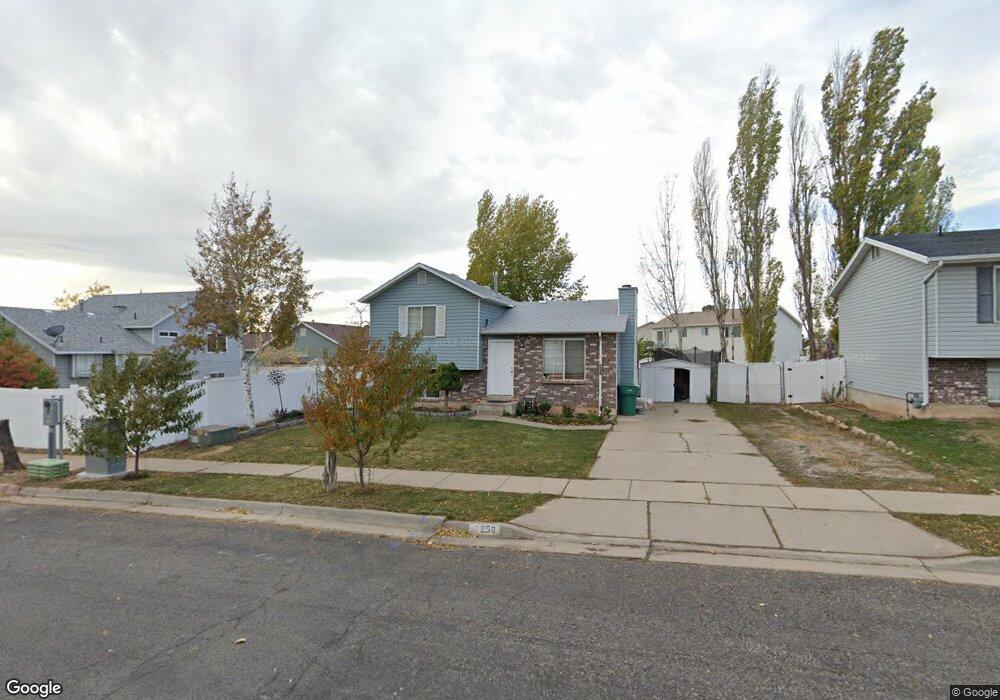
This home is located at 258 N 400 W, Clearfield, UT 84015 and is currently estimated at $377,368, approximately $291 per square foot. 258 N 400 W is a home located in Davis County with nearby schools including Holt Elementary School, North Davis Junior High School, and Clearfield High School.
Ownership History
Date
Name
Owned For
Owner Type
Purchase Details
Closed on
Nov 6, 2009
Sold by
Anderson Chris
Bought by
Anderson Dana Christain
Current Estimated Value
Home Financials for this Owner
Home Financials are based on the most recent Mortgage that was taken out on this home.
Original Mortgage
$133,207
Outstanding Balance
$86,220
Interest Rate
4.83%
Mortgage Type
FHA
Estimated Equity
$291,148
Purchase Details
Closed on
Jul 25, 2008
Sold by
Daily Emil J and Daily Leah
Bought by
Anderson Chris
Home Financials for this Owner
Home Financials are based on the most recent Mortgage that was taken out on this home.
Original Mortgage
$131,239
Interest Rate
6.41%
Mortgage Type
Purchase Money Mortgage
Purchase Details
Closed on
Sep 7, 2004
Sold by
Vakilian Hady and Vakilian Barbara
Bought by
Daily Emil J and Daily Leah
Home Financials for this Owner
Home Financials are based on the most recent Mortgage that was taken out on this home.
Original Mortgage
$101,408
Interest Rate
6.06%
Mortgage Type
FHA
Create a Home Valuation Report for This Property
The Home Valuation Report is an in-depth analysis detailing your home's value as well as a comparison with similar homes in the area
Home Values in the Area
Average Home Value in this Area
Purchase History
| Date | Buyer | Sale Price | Title Company |
|---|---|---|---|
| Anderson Dana Christain | -- | Accommodation | |
| Anderson Chris | -- | Backman Title Services | |
| Daily Emil J | -- | Backman Stewart Title Svcs |
Source: Public Records
Mortgage History
| Date | Status | Borrower | Loan Amount |
|---|---|---|---|
| Open | Anderson Dana Christain | $133,207 | |
| Closed | Anderson Chris | $131,239 | |
| Previous Owner | Daily Emil J | $101,408 |
Source: Public Records
Tax History Compared to Growth
Tax History
| Year | Tax Paid | Tax Assessment Tax Assessment Total Assessment is a certain percentage of the fair market value that is determined by local assessors to be the total taxable value of land and additions on the property. | Land | Improvement |
|---|---|---|---|---|
| 2025 | $2,044 | $183,150 | $59,232 | $123,918 |
| 2024 | $1,980 | $178,750 | $56,713 | $122,037 |
| 2023 | $1,835 | $304,000 | $91,946 | $212,054 |
| 2022 | $1,933 | $173,250 | $53,833 | $119,417 |
| 2021 | $1,787 | $242,000 | $51,297 | $190,703 |
| 2020 | $1,539 | $207,000 | $42,112 | $164,888 |
| 2019 | $1,499 | $199,000 | $48,045 | $150,955 |
| 2018 | $1,346 | $174,000 | $42,644 | $131,356 |
| 2016 | $1,184 | $80,025 | $16,642 | $63,383 |
| 2015 | $1,125 | $72,490 | $16,642 | $55,848 |
| 2014 | $1,068 | $69,781 | $16,642 | $53,139 |
| 2013 | -- | $60,509 | $29,266 | $31,243 |
Source: Public Records
Map
Nearby Homes