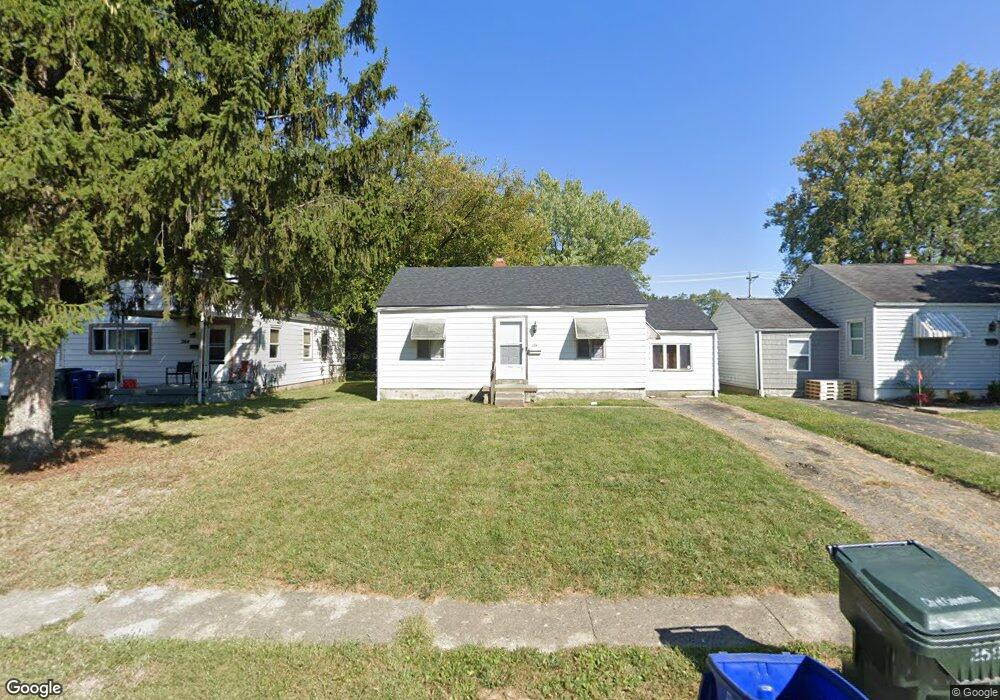
258 N Virginialee Rd Columbus, OH 43209
Broadleigh NeighborhoodEstimated Value: $159,983 - $201,000
2
Beds
1
Bath
924
Sq Ft
$189/Sq Ft
Est. Value
About This Home
This home is located at 258 N Virginialee Rd, Columbus, OH 43209 and is currently estimated at $174,496, approximately $188 per square foot. 258 N Virginialee Rd is a home located in Franklin County with nearby schools including Broadleigh Elementary School, Johnson Park Middle School, and Walnut Ridge High School.
Ownership History
Date
Name
Owned For
Owner Type
Purchase Details
Closed on
May 7, 2015
Sold by
Ddroi Properties Llc
Bought by
Kapoor Randeep and Kapoor Sabby
Current Estimated Value
Purchase Details
Closed on
Jul 26, 1999
Sold by
Charna Debra L and Charna Daniel A
Bought by
Charna Two Ltd Partnership
Purchase Details
Closed on
Feb 1, 1999
Sold by
Charna Two Ltd Partnership
Bought by
Charna Daniel A and Charna Debra L
Home Financials for this Owner
Home Financials are based on the most recent Mortgage that was taken out on this home.
Original Mortgage
$26,800
Interest Rate
6.78%
Purchase Details
Closed on
Dec 14, 1998
Sold by
Charna Debra L and Charna Daniel A
Bought by
Charna Two Ltd Partnership
Home Financials for this Owner
Home Financials are based on the most recent Mortgage that was taken out on this home.
Original Mortgage
$26,800
Interest Rate
6.78%
Purchase Details
Closed on
Feb 28, 1990
Purchase Details
Closed on
Sep 28, 1988
Create a Home Valuation Report for This Property
The Home Valuation Report is an in-depth analysis detailing your home's value as well as a comparison with similar homes in the area
Home Values in the Area
Average Home Value in this Area
Purchase History
| Date | Buyer | Sale Price | Title Company |
|---|---|---|---|
| Kapoor Randeep | $32,000 | None Available | |
| Charna Two Ltd Partnership | -- | -- | |
| Charna Daniel A | -- | Cardinal Title | |
| Charna Two Ltd Partnership | -- | -- | |
| -- | -- | -- | |
| -- | -- | -- |
Source: Public Records
Mortgage History
| Date | Status | Borrower | Loan Amount |
|---|---|---|---|
| Previous Owner | Charna Daniel A | $26,800 |
Source: Public Records
Tax History Compared to Growth
Tax History
| Year | Tax Paid | Tax Assessment Tax Assessment Total Assessment is a certain percentage of the fair market value that is determined by local assessors to be the total taxable value of land and additions on the property. | Land | Improvement |
|---|---|---|---|---|
| 2024 | $2,379 | $51,910 | $18,030 | $33,880 |
| 2023 | $2,349 | $51,910 | $18,030 | $33,880 |
| 2022 | $1,349 | $25,380 | $6,760 | $18,620 |
| 2021 | $1,574 | $25,380 | $6,760 | $18,620 |
| 2020 | $1,454 | $25,380 | $6,760 | $18,620 |
| 2019 | $1,302 | $20,940 | $5,640 | $15,300 |
| 2018 | $650 | $20,940 | $5,640 | $15,300 |
| 2017 | $1,302 | $20,940 | $5,640 | $15,300 |
| 2016 | $1,173 | $17,260 | $4,170 | $13,090 |
| 2015 | $534 | $17,260 | $4,170 | $13,090 |
| 2014 | $1,070 | $17,260 | $4,170 | $13,090 |
| 2013 | $556 | $18,165 | $4,375 | $13,790 |
Source: Public Records
Map
Nearby Homes
- 263 Edgevale Rd
- 238 Edgevale Rd
- 243 N James Rd
- 253 N James Rd
- 177 N James Rd
- 205 N Gould Rd
- 73 N Everett Ave
- 124 N Gould Rd
- 59 N Everett Ave
- 47 N Chesterfield Rd
- 50 N Broadleigh Rd
- 73 N Hampton Rd
- 94 N Hampton Rd
- 2867 Ruhl Ave Unit 869
- 88-90 N Waverly St
- 3121 E 5th Ave
- 3216 E 5th Ave
- 50 S Chesterfield Rd
- 3116 E 5th Ave
- 2779 Columbus Ave
- 264 N Virginialee Rd
- 252 N Virginialee Rd
- 270 N Virginia Lee
- 270 N Virginialee Rd
- 244 N Virginialee Rd
- 251 Edgevale Rd
- 238 N Virginialee Rd
- 257 Edgevale Rd
- 245 Edgevale Rd
- 239 Edgevale Rd
- 282 N Virginialee Rd
- 269 Edgevale Rd
- 231 Edgevale Rd
- 275 Edgevale Rd
- 225 Edgevale Rd
- 283 Edgevale Rd
- 219 Edgevale Rd
- 220 N Virginialee Rd
- 213 Edgevale Rd