Estimated Value: $190,759 - $320,000
2
Beds
1
Bath
872
Sq Ft
$276/Sq Ft
Est. Value
About This Home
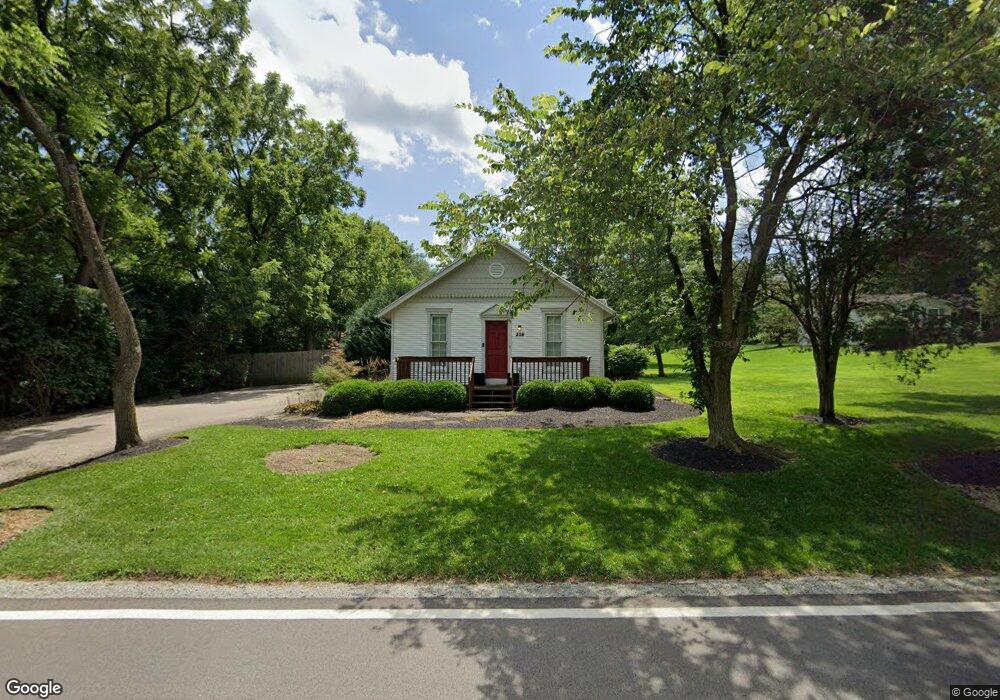
This home is located at 258 S Alpha Bellbrook Rd, Xenia, OH 45385 and is currently estimated at $240,440, approximately $275 per square foot. 258 S Alpha Bellbrook Rd is a home located in Greene County with nearby schools including Fairbrook Elementary School, Herman K Ankeney Middle School, and Beavercreek High School.
Ownership History
Date
Name
Owned For
Owner Type
Purchase Details
Closed on
Aug 6, 2007
Sold by
Updike Ryan and Updike Jennifer C
Bought by
Trentel Matthew T
Current Estimated Value
Home Financials for this Owner
Home Financials are based on the most recent Mortgage that was taken out on this home.
Original Mortgage
$119,200
Outstanding Balance
$75,587
Interest Rate
6.69%
Mortgage Type
Unknown
Estimated Equity
$164,853
Purchase Details
Closed on
Oct 15, 2003
Sold by
Otherson Charles and Otherson Jacqueline M
Bought by
Updike Ryan and Coates Jennifer C
Home Financials for this Owner
Home Financials are based on the most recent Mortgage that was taken out on this home.
Original Mortgage
$96,690
Interest Rate
6.04%
Mortgage Type
Unknown
Purchase Details
Closed on
Oct 16, 2000
Sold by
Shannon Mark A
Bought by
Otherson Charles
Purchase Details
Closed on
Jun 1, 1999
Sold by
Bolser Mary Deborah
Bought by
Shannon Mark A
Purchase Details
Closed on
Jan 24, 1997
Sold by
Koogler Benjamin F
Bought by
Bolser Mary D
Create a Home Valuation Report for This Property
The Home Valuation Report is an in-depth analysis detailing your home's value as well as a comparison with similar homes in the area
Home Values in the Area
Average Home Value in this Area
Purchase History
| Date | Buyer | Sale Price | Title Company |
|---|---|---|---|
| Trentel Matthew T | $149,000 | Attorney | |
| Updike Ryan | $203,600 | -- | |
| Otherson Charles | $45,000 | -- | |
| Shannon Mark A | $28,000 | -- | |
| Bolser Mary D | $10,000 | -- |
Source: Public Records
Mortgage History
| Date | Status | Borrower | Loan Amount |
|---|---|---|---|
| Open | Trentel Matthew T | $119,200 | |
| Previous Owner | Updike Ryan | $96,690 |
Source: Public Records
Tax History Compared to Growth
Tax History
| Year | Tax Paid | Tax Assessment Tax Assessment Total Assessment is a certain percentage of the fair market value that is determined by local assessors to be the total taxable value of land and additions on the property. | Land | Improvement |
|---|---|---|---|---|
| 2024 | $3,007 | $52,350 | $18,900 | $33,450 |
| 2023 | $3,007 | $52,350 | $18,900 | $33,450 |
| 2022 | $2,764 | $42,190 | $15,750 | $26,440 |
| 2021 | $2,791 | $42,190 | $15,750 | $26,440 |
| 2020 | $2,805 | $42,190 | $15,750 | $26,440 |
| 2019 | $3,034 | $41,910 | $15,750 | $26,160 |
| 2018 | $2,652 | $41,910 | $15,750 | $26,160 |
| 2017 | $2,471 | $41,910 | $15,750 | $26,160 |
| 2016 | $2,438 | $37,990 | $15,750 | $22,240 |
| 2015 | $2,453 | $37,990 | $15,750 | $22,240 |
| 2014 | $2,398 | $37,990 | $15,750 | $22,240 |
Source: Public Records
Map
Nearby Homes
- 264 S Alpha Bellbrook Rd
- 3109 Indian Ripple Rd
- 3211 Tarleton Dr
- 122 Parkhurst Rd
- 131 Ridgebrook Trail
- 679 S Alpha Bellbrook Rd
- 179 Honey Jane Dr
- 197 Bramblebush Trail
- 185 Bramblebush Trail
- 281 Locust Ct
- 91 Cherry Hill Dr
- 3597 Echo Hill Ln
- 3985 Shagbark Ln
- 3132 Casler Ave
- 3878 Pepperwell Cir
- 3899 Pepperwell Cir
- 153 George Wythe Way
- 2940 Stonewall Dr
- 2580 Paydon Randoff Rd
- 463 Valhalla Ct
- 257 S Alpha Bellbrook Rd
- 260 S Alpha Bellbrook Rd
- 259 S Alpha Bellbrook Rd
- 3174 Sonnyann Place
- 253 S Alpha Bellbrook Rd
- 3178 Sonnyann Place
- 261 S Alpha Bellbrook Rd
- 263 S Alpha Bellbrook Rd
- 266 S Alpha Bellbrook Rd
- 3160 Sonnyann Place
- 265 S Alpha Bellbrook Rd
- 280 S Alpha Bellbrook Rd
- 3175 Sonnyann Place
- 300 S Alpha Bellbrook Rd
- 233 S Alpha Bellbrook Rd
- 281 S Alpha Bellbrook Rd
- 3270 Swigart Rd
- 3270 Swigart Rd
- 299 S Alpha Bellbrook Rd
- 255 S Alpha Bellbrook Rd