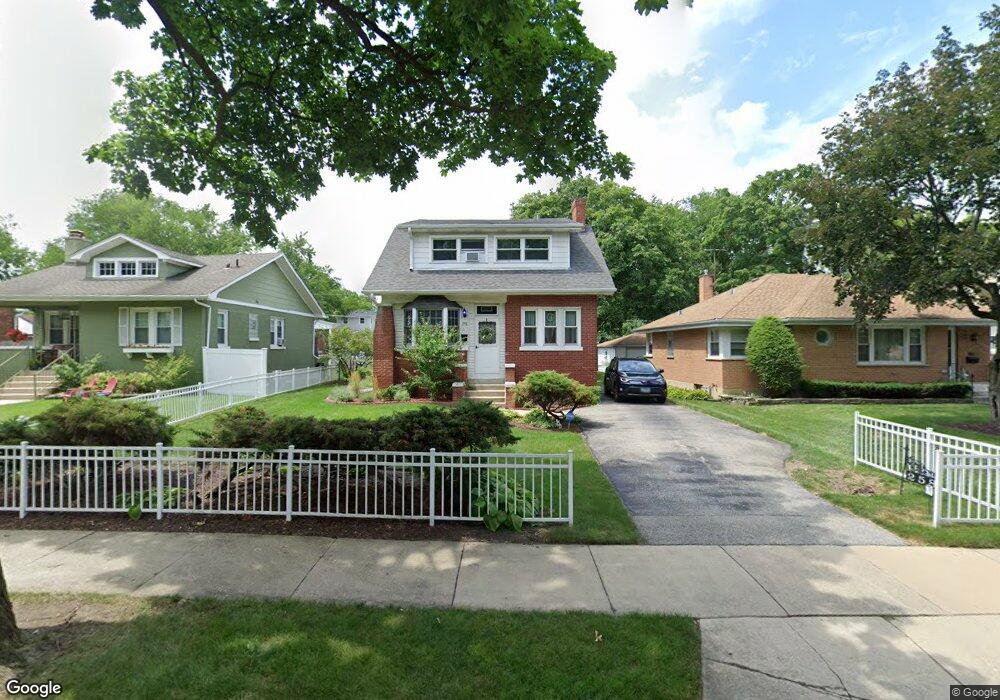
258 S Monterey Ave Elmhurst, IL 60126
Estimated Value: $393,000 - $457,000
--
Bed
--
Bath
1,512
Sq Ft
$282/Sq Ft
Est. Value
About This Home
This home is located at 258 S Monterey Ave, Elmhurst, IL 60126 and is currently estimated at $426,757, approximately $282 per square foot. 258 S Monterey Ave is a home located in DuPage County with nearby schools including North Elementary School, Jefferson Middle School, and Willowbrook High School.
Ownership History
Date
Name
Owned For
Owner Type
Purchase Details
Closed on
Aug 17, 2021
Sold by
Flanagan Patricia E and Lloyd Anna K
Bought by
Flanagan Patricia E and Lloyd Anna K
Current Estimated Value
Purchase Details
Closed on
Mar 18, 2010
Sold by
Flanagan Virginia Lee
Bought by
Flanagan Virginia Lee and Flanagan Patricia E
Purchase Details
Closed on
May 28, 1997
Sold by
West Suburban Bank
Bought by
Flanagan Virginia Lee
Create a Home Valuation Report for This Property
The Home Valuation Report is an in-depth analysis detailing your home's value as well as a comparison with similar homes in the area
Home Values in the Area
Average Home Value in this Area
Purchase History
| Date | Buyer | Sale Price | Title Company |
|---|---|---|---|
| Flanagan Patricia E | -- | Attorney | |
| Flanagan Virginia Lee | -- | None Available | |
| Flanagan Virginia Lee | -- | -- |
Source: Public Records
Tax History Compared to Growth
Tax History
| Year | Tax Paid | Tax Assessment Tax Assessment Total Assessment is a certain percentage of the fair market value that is determined by local assessors to be the total taxable value of land and additions on the property. | Land | Improvement |
|---|---|---|---|---|
| 2024 | $6,884 | $112,617 | $34,475 | $78,142 |
| 2023 | $6,337 | $104,140 | $31,880 | $72,260 |
| 2022 | $5,997 | $95,450 | $30,640 | $64,810 |
| 2021 | $6,033 | $93,080 | $29,880 | $63,200 |
| 2020 | $6,887 | $102,600 | $29,220 | $73,380 |
| 2019 | $6,483 | $97,550 | $27,780 | $69,770 |
| 2018 | $4,998 | $73,630 | $26,290 | $47,340 |
| 2017 | $4,894 | $70,160 | $25,050 | $45,110 |
| 2016 | $4,435 | $66,100 | $23,600 | $42,500 |
| 2015 | $4,332 | $61,580 | $21,990 | $39,590 |
| 2014 | $6,066 | $83,580 | $20,080 | $63,500 |
| 2013 | $6,016 | $84,750 | $20,360 | $64,390 |
Source: Public Records
Map
Nearby Homes
- 169 S Villa Ave
- 255 S West Ave Unit 309
- 255 S West Ave Unit 308
- 255 S West Ave Unit 413
- 508 W Alma St
- 248 E Kenilworth Ave
- 452 W Alma St
- 421 S Sunnyside Ave
- 156 S Sunnyside Ave
- 469 S Sunnyside Ave
- 530 E Highland Ave Unit A2
- 114 E Kenilworth Ave
- 117 E Vermont St
- 206 S Hawthorne Ave
- 316 E Highland Ave
- 235 N Ardmore Ave
- 247 N Ardmore Ave
- 490 N Chatham Ave
- 17W517 Manor Ln
- 204 E Hill St
- 262 S Monterey Ave
- 254 S Monterey Ave
- 250 S Monterey Ave
- 270 S Monterey Ave
- 259 S Oakland Grove
- 255 S Oakland Grove
- 263 S Oakland Grove
- 246 S Monterey Ave
- 251 S Oakland Grove
- 267 S Oakland Grove
- 274 S Monterey Ave
- 242 S Monterey Ave
- 271 S Oakland Grove
- 267 S Monterey Ave
- 255 S Monterey Ave
- 243 S Oakland Grove
- 271 S Monterey Ave
- 278 S Monterey Ave
- 238 S Monterey Ave
- 263 S Monterey Ave