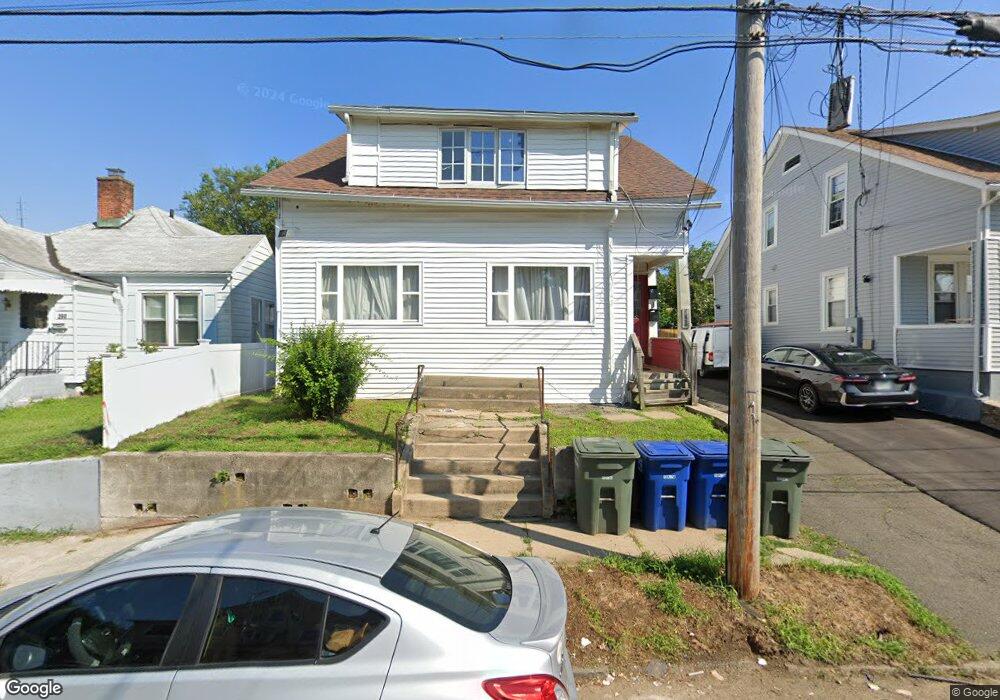
258 Salem St Bridgeport, CT 06606
Brooklawn-Saint Vincent NeighborhoodEstimated Value: $410,260 - $585,000
4
Beds
3
Baths
2,103
Sq Ft
$223/Sq Ft
Est. Value
About This Home
This home is located at 258 Salem St, Bridgeport, CT 06606 and is currently estimated at $468,315, approximately $222 per square foot. 258 Salem St is a home located in Fairfield County with nearby schools including Madison School, Central High School, and Catholic Academy of Bridgeport-St. Raphael Academy.
Ownership History
Date
Name
Owned For
Owner Type
Purchase Details
Closed on
Mar 1, 2022
Sold by
Fitzgerald Nicole M
Bought by
Fitzgerald Nicole M
Current Estimated Value
Purchase Details
Closed on
Feb 11, 2021
Sold by
Datz Gabor
Bought by
Us Bank Na Tr
Purchase Details
Closed on
Nov 27, 2019
Sold by
Tumba Beatrice
Bought by
Us Bank Na
Purchase Details
Closed on
Jan 15, 2003
Sold by
Aragada Christopher
Bought by
Tumba Amisi E
Purchase Details
Closed on
Aug 13, 2001
Sold by
Negedy Abdulmalik
Bought by
Aragbada Christopher
Purchase Details
Closed on
Dec 10, 1999
Sold by
Ukuta Betty B
Bought by
Negedu Abdulmalik
Purchase Details
Closed on
Oct 28, 1996
Sold by
Brookmeier Donata V
Bought by
Ukuta Betty B
Create a Home Valuation Report for This Property
The Home Valuation Report is an in-depth analysis detailing your home's value as well as a comparison with similar homes in the area
Home Values in the Area
Average Home Value in this Area
Purchase History
| Date | Buyer | Sale Price | Title Company |
|---|---|---|---|
| Fitzgerald Nicole M | -- | None Available | |
| Fitzgerald Nicole M | -- | None Available | |
| Us Bank Na Tr | -- | None Available | |
| Us Bank Na Tr | -- | None Available | |
| Us Bank Na | -- | -- | |
| Us Bank Na | -- | -- | |
| Tumba Amisi E | $215,000 | -- | |
| Tumba Amisi E | $215,000 | -- | |
| Aragbada Christopher | $179,900 | -- | |
| Aragbada Christopher | $179,900 | -- | |
| Negedu Abdulmalik | $153,000 | -- | |
| Negedu Abdulmalik | $153,000 | -- | |
| Ukuta Betty B | $76,500 | -- | |
| Ukuta Betty B | $76,500 | -- |
Source: Public Records
Mortgage History
| Date | Status | Borrower | Loan Amount |
|---|---|---|---|
| Previous Owner | Ukuta Betty B | $288,000 | |
| Previous Owner | Ukuta Betty B | $285,000 |
Source: Public Records
Tax History
| Year | Tax Paid | Tax Assessment Tax Assessment Total Assessment is a certain percentage of the fair market value that is determined by local assessors to be the total taxable value of land and additions on the property. | Land | Improvement |
|---|---|---|---|---|
| 2025 | $5,823 | $134,010 | $68,540 | $65,470 |
| 2024 | $5,823 | $134,010 | $68,540 | $65,470 |
| 2023 | $5,823 | $134,010 | $68,540 | $65,470 |
| 2022 | $5,823 | $134,010 | $68,540 | $65,470 |
| 2021 | $5,823 | $134,010 | $68,540 | $65,470 |
| 2020 | $7,711 | $142,830 | $38,680 | $104,150 |
| 2019 | $7,711 | $142,830 | $38,680 | $104,150 |
| 2018 | $7,766 | $142,830 | $38,680 | $104,150 |
| 2017 | $7,766 | $142,830 | $38,680 | $104,150 |
| 2016 | $7,766 | $142,830 | $38,680 | $104,150 |
| 2015 | $7,791 | $184,610 | $46,810 | $137,800 |
| 2014 | $7,791 | $184,610 | $46,810 | $137,800 |
Source: Public Records
Map
Nearby Homes
- 92 Lincoln Ave
- 248 Salem St
- 155 Marion St
- 157 Anson St
- 345 Capitol Ave
- 201 French St Unit 203
- 123 Harlem Ave
- 74 Harlem Ave
- 203 Wayne St
- 356 Madison Terrace
- 936 Lindley St
- 130 Holroyd St
- 208 Fairview Ave Unit 210
- 252 Harlem Ave Unit C4
- 25 Westfield Ave
- 78 Fairmount Ave
- 23-25 Morgan Ave
- 457 Summit St
- 329 Ezra St
- 95-97 Savoy St
- 260 Salem St
- 276 Salem St
- 234 Salem St Unit 236
- 230 Salem St
- 284 Salem St
- 249 Salem St Unit 253
- 263C Salem St
- 47 Marion St Unit 49
- 49 Marion St
- 33 Marion St Unit 35
- 33 Marion St Unit 1st Fl.
- 273 Salem St
- 71 Marion St Unit 73
- 263 Salem St
- 2649 Main St
- 283 Salem St
- 25 Marion St Unit 27
- 2635 Main St
- 306 Salem St
- 2669 Main St Unit 2671
Your Personal Tour Guide
Ask me questions while you tour the home.