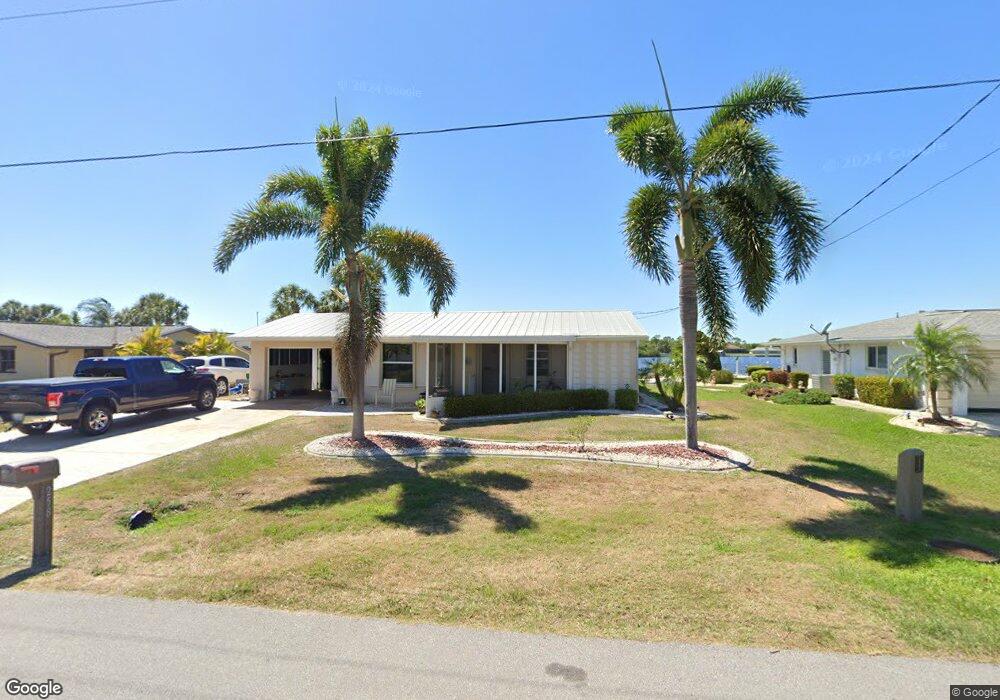
258 Spring Lake Blvd NW Port Charlotte, FL 33952
Estimated Value: $225,000 - $418,000
2
Beds
2
Baths
1,822
Sq Ft
$185/Sq Ft
Est. Value
About This Home
This home is located at 258 Spring Lake Blvd NW, Port Charlotte, FL 33952 and is currently estimated at $337,095, approximately $185 per square foot. 258 Spring Lake Blvd NW is a home located in Charlotte County with nearby schools including Peace River Elementary School, Murdock Middle School, and Port Charlotte High School.
Ownership History
Date
Name
Owned For
Owner Type
Purchase Details
Closed on
May 10, 2021
Sold by
Our Property Llc
Bought by
Ogilvy William E and Ogilvy April K
Current Estimated Value
Purchase Details
Closed on
Nov 3, 2020
Sold by
Welbourne Richard and Welbourne Jay
Bought by
Our Property Llc
Home Financials for this Owner
Home Financials are based on the most recent Mortgage that was taken out on this home.
Original Mortgage
$80,000
Interest Rate
1%
Mortgage Type
Seller Take Back
Purchase Details
Closed on
Jul 10, 2015
Sold by
Skolas Norma Jean and Norma Jean Skolas Living Trust
Bought by
Graebner Donna J
Purchase Details
Closed on
Sep 22, 1999
Sold by
Skolas Deno P
Bought by
Skolas Norma Jean
Purchase Details
Closed on
Mar 6, 1995
Sold by
Coleshill Renate Zimmermann
Bought by
Skolas Deno P
Home Financials for this Owner
Home Financials are based on the most recent Mortgage that was taken out on this home.
Original Mortgage
$60,000
Interest Rate
9.13%
Create a Home Valuation Report for This Property
The Home Valuation Report is an in-depth analysis detailing your home's value as well as a comparison with similar homes in the area
Home Values in the Area
Average Home Value in this Area
Purchase History
| Date | Buyer | Sale Price | Title Company |
|---|---|---|---|
| Ogilvy William E | $330,000 | Attorney | |
| Our Property Llc | $231,000 | Attorney | |
| Graebner Donna J | $225,000 | Msc Title Inc | |
| Skolas Norma Jean | -- | -- | |
| Skolas Deno P | $90,000 | -- |
Source: Public Records
Mortgage History
| Date | Status | Borrower | Loan Amount |
|---|---|---|---|
| Previous Owner | Our Property Llc | $80,000 | |
| Previous Owner | Skolas Deno P | $60,000 |
Source: Public Records
Tax History Compared to Growth
Tax History
| Year | Tax Paid | Tax Assessment Tax Assessment Total Assessment is a certain percentage of the fair market value that is determined by local assessors to be the total taxable value of land and additions on the property. | Land | Improvement |
|---|---|---|---|---|
| 2023 | $6,619 | $336,970 | $0 | $0 |
| 2022 | $6,062 | $306,336 | $127,500 | $178,836 |
| 2021 | $4,722 | $213,992 | $80,750 | $133,242 |
| 2020 | $3,456 | $178,521 | $0 | $0 |
| 2019 | $3,356 | $174,507 | $0 | $0 |
| 2018 | $3,137 | $171,253 | $0 | $0 |
| 2017 | $3,111 | $167,731 | $51,000 | $116,731 |
| 2016 | $3,377 | $181,084 | $0 | $0 |
| 2015 | $3,914 | $168,274 | $0 | $0 |
| 2014 | $3,621 | $152,976 | $0 | $0 |
Source: Public Records
Map
Nearby Homes
- 543 Lincoln Ave NW
- 264 E Tarpon Blvd NW
- 579 Lakemont Ave NW
- 549 Lakemont Ave NW
- 312 E Tarpon Blvd NW
- 530 Lakemont Ave NW
- 457 Glenridge Ave NW
- 520 Fenton Ave NW
- 474 Elm Ave NW
- 439 Spring Lake Blvd NW
- 117 W Tarpon Blvd NW
- 325 Millport St NW
- 374 Millport St NW
- 358 Millport St NW
- 417 Glenridge Ave NW
- 389 Millport St NW
- 542 Lakehurst Ave NW
- 536 Lakehurst Ave NW
- 563 Meridan Ave NW
- 733 Springview Ave NW
- 250 Spring Lake Blvd NW
- 266 Spring Lake Blvd NW
- 274 Spring Lake Blvd NW
- 242 Spring Lake Blvd NW
- 211 Spring Lake Blvd NW
- 585 Mayview Ave NW
- 556 Mayview Ave NW
- 282 Spring Lake Blvd NW
- 234 Spring Lake Blvd NW
- 570 Melrose Ave NW
- 571 Mayview Ave NW
- 585 Melrose Ave NW
- 226 Spring Lake Blvd NW
- 290 Spring Lake Blvd NW
- 317 Spring Lake Blvd NW
- 556 Melrose Ave NW
- 571 Melrose Ave NW
- 557 Mayview Ave NW
- 584 Mimosa Ave NW
- 218 Spring Lake Blvd NW