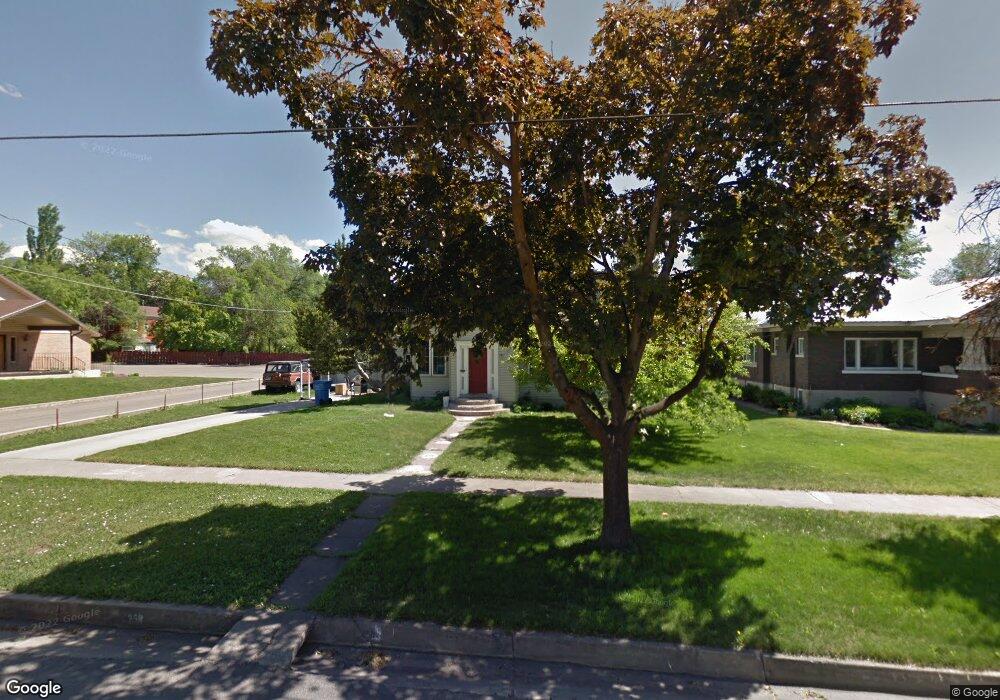
258 W 200 N Logan, UT 84321
Ellis NeighborhoodEstimated Value: $382,000 - $409,843
3
Beds
2
Baths
1,777
Sq Ft
$224/Sq Ft
Est. Value
About This Home
This home is located at 258 W 200 N, Logan, UT 84321 and is currently estimated at $398,711, approximately $224 per square foot. 258 W 200 N is a home located in Cache County with nearby schools including Ellis School, Mount Logan Middle School, and Logan High School.
Ownership History
Date
Name
Owned For
Owner Type
Purchase Details
Closed on
Dec 5, 2018
Sold by
Logan Church Of Christ
Bought by
Black Scott Steven and Black Ellen Elisabeth
Current Estimated Value
Home Financials for this Owner
Home Financials are based on the most recent Mortgage that was taken out on this home.
Original Mortgage
$144,000
Outstanding Balance
$90,202
Interest Rate
4.8%
Mortgage Type
New Conventional
Estimated Equity
$308,509
Purchase Details
Closed on
Nov 19, 2018
Sold by
Logan Church Of Christ
Bought by
Logan Church Of Christ
Home Financials for this Owner
Home Financials are based on the most recent Mortgage that was taken out on this home.
Original Mortgage
$144,000
Outstanding Balance
$90,202
Interest Rate
4.8%
Mortgage Type
New Conventional
Estimated Equity
$308,509
Purchase Details
Closed on
Sep 17, 2002
Sold by
Skidmore Kevin
Bought by
Church Of Christ
Create a Home Valuation Report for This Property
The Home Valuation Report is an in-depth analysis detailing your home's value as well as a comparison with similar homes in the area
Home Values in the Area
Average Home Value in this Area
Purchase History
We collect this data history from publicly available records. To have your information removed, we recommend requesting removal directly through your county’s website.
| Date | Buyer | Sale Price | Title Company |
|---|---|---|---|
| Black Scott Steven | -- | Backman Title Services Ltd | |
| Logan Church Of Christ | -- | Backman Title Services Ltd | |
| Church Of Christ | -- | Hickman Land Title Company |
Source: Public Records
Mortgage History
We collect this data history from publicly available records. To have your information removed, we recommend requesting removal directly through your county’s website.
| Date | Status | Borrower | Loan Amount |
|---|---|---|---|
| Open | Black Scott Steven | $144,000 |
Source: Public Records
Tax History
| Year | Tax Paid | Tax Assessment Tax Assessment Total Assessment is a certain percentage of the fair market value that is determined by local assessors to be the total taxable value of land and additions on the property. | Land | Improvement |
|---|---|---|---|---|
| 2025 | $1,659 | $214,545 | $0 | $0 |
| 2024 | $1,705 | $213,560 | $0 | $0 |
| 2023 | $1,785 | $213,120 | $0 | $0 |
| 2022 | $1,745 | $194,605 | $0 | $0 |
| 2021 | $1,286 | $221,520 | $52,780 | $168,740 |
| 2020 | $1,178 | $182,580 | $52,780 | $129,800 |
| 2019 | $1,231 | $182,580 | $52,780 | $129,800 |
| 2018 | $0 | $140,680 | $52,780 | $87,900 |
| 2017 | $0 | $0 | $0 | $0 |
| 2016 | -- | $0 | $0 | $0 |
| 2015 | -- | $0 | $0 | $0 |
| 2014 | -- | $0 | $0 | $0 |
| 2013 | -- | $76,260 | $0 | $0 |
Source: Public Records
Map
Nearby Homes
Your Personal Tour Guide
Ask me questions while you tour the home.