
Landlord's Agent in 2024
Daniel Effenberger
O'Brien Realty, LLC
(732) 597-4312
23 in this area
113 Total Sales


Estimated Value: $838,228 - $1,161,000
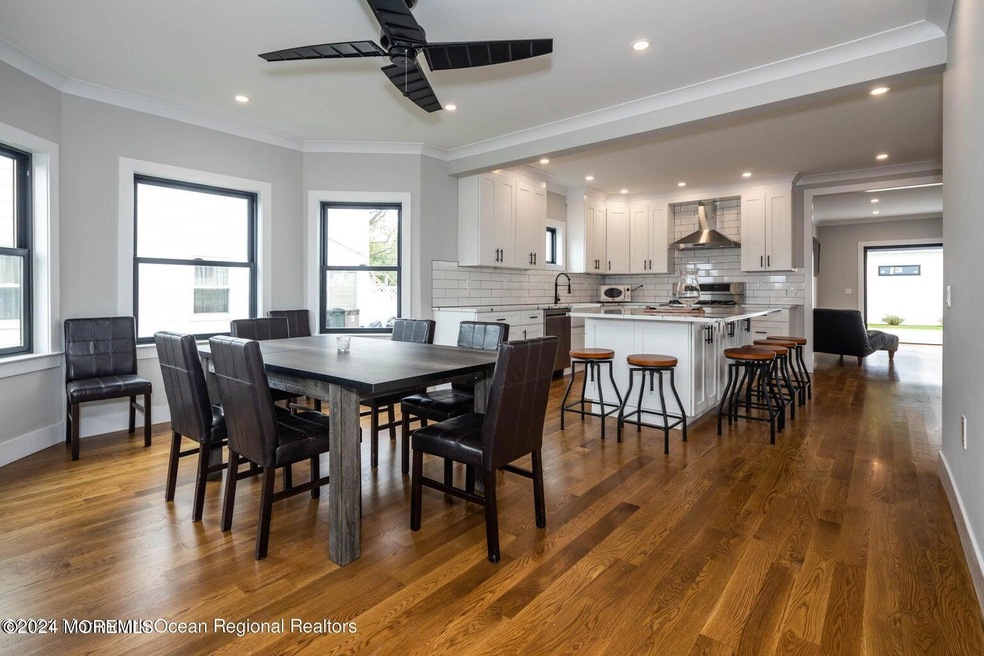
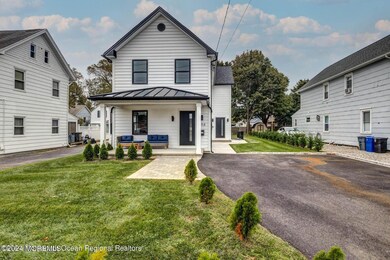
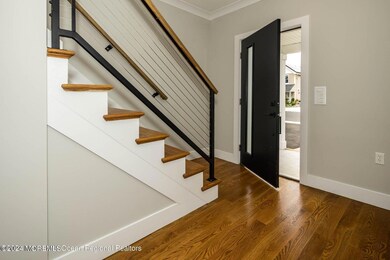
SUMMER RENTAL! Welcome to the West End of Long Branch, just blocks to the beach in one of the most desirable neighborhoods in town! This gorgeous home was rebuilt in 2020 and features 5 beds and 4 baths. Great open floor plan and plenty of space for the whole family. Chef's kitchen, In-House Laundry, and a backyard perfect for summer nights. All Utilities Included! Bonus month of May included as well. Make your appt today this gem won't last!
Last Agent to Rent the Property
O'Brien Realty, LLC License #1649940 Listed on: 04/11/2024
| Date | Buyer | Sale Price | Title Company |
|---|---|---|---|
| Viera Marco | $200,000 | Fidelity National Ttl Ins Co |
| Date | Event | Price | List to Sale | Price per Sq Ft | Prior Sale |
|---|---|---|---|---|---|
| 05/20/2024 05/20/24 | Rented | $36,000 | -10.0% | -- | |
| 05/07/2024 05/07/24 | Under Contract | -- | -- | -- | |
| 04/11/2024 04/11/24 | For Rent | $40,000 | +27.0% | -- | |
| 10/27/2021 10/27/21 | Rented | $31,500 | +800.0% | -- | |
| 10/22/2021 10/22/21 | For Rent | $3,500 | 0.0% | -- | |
| 10/23/2019 10/23/19 | Sold | $200,000 | -- | $143 / Sq Ft | View Prior Sale |
| Year | Tax Paid | Tax Assessment Tax Assessment Total Assessment is a certain percentage of the fair market value that is determined by local assessors to be the total taxable value of land and additions on the property. | Land | Improvement |
|---|---|---|---|---|
| 2025 | $11,257 | $953,200 | $483,900 | $469,300 |
| 2024 | $10,268 | $732,400 | $376,600 | $355,800 |
| 2023 | $10,268 | $661,200 | $321,600 | $339,600 |
| 2022 | $4,502 | $311,200 | $215,400 | $95,800 |
| 2021 | $4,502 | $225,000 | $135,400 | $89,600 |
| 2020 | $4,629 | $221,500 | $132,400 | $89,100 |
| 2019 | $4,465 | $212,400 | $127,400 | $85,000 |
| 2018 | $4,530 | $214,300 | $132,400 | $81,900 |
| 2017 | $4,239 | $205,700 | $125,400 | $80,300 |
| 2016 | $5,499 | $272,100 | $130,400 | $141,700 |
| 2015 | $3,511 | $168,900 | $82,600 | $86,300 |
| 2014 | $3,587 | $181,600 | $105,000 | $76,600 |
Landlord's Agent in 2024
Daniel Effenberger
O'Brien Realty, LLC
(732) 597-4312
23 in this area
113 Total Sales
Tenant's Agent in 2024
Dena Erani
Meyer Edery Real Estate Agency INC.
(732) 546-0877
10 in this area
28 Total Sales
P
Seller's Agent in 2021
Peter Cunha
Open Doors Realty, LLC
M
Seller Co-Listing Agent in 2021
Marco Vieira
Open Doors Realty, LLC
Seller's Agent in 2019
Roberto Muolo
A Mancini Realty
(732) 241-7713
8 in this area
13 Total Sales
Source: MOREMLS (Monmouth Ocean Regional REALTORS®)
MLS Number: 22409857
APN: 27-00117-0000-00009
Disclaimer: Certain information contained herein is derived from information provided by parties other than Homes.com. All information provided is deemed reliable, but is not guaranteed to be accurate and should be independently verified.
![]() IDX information is provided exclusively for personal, non-commercial use, and may not be used for any purpose other than to identify prospective properties consumers may be interested in purchasing.
IDX information is provided exclusively for personal, non-commercial use, and may not be used for any purpose other than to identify prospective properties consumers may be interested in purchasing.
Information is deemed reliable but not guaranteed.