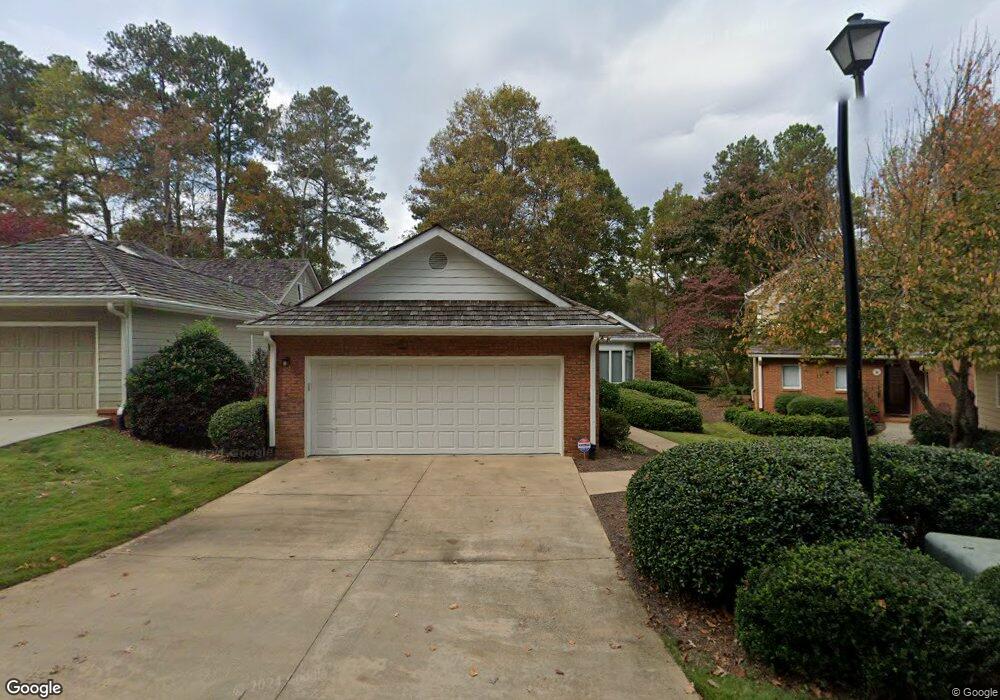
2580 Camden Glen Ct Unit 13 Roswell, GA 30076
Willow Springs NeighborhoodEstimated Value: $534,540 - $678,000
3
Beds
2
Baths
1,983
Sq Ft
$306/Sq Ft
Est. Value
About This Home
This home is located at 2580 Camden Glen Ct Unit 13, Roswell, GA 30076 and is currently estimated at $606,135, approximately $305 per square foot. 2580 Camden Glen Ct Unit 13 is a home located in Fulton County with nearby schools including Northwood Elementary School, Haynes Bridge Middle School, and Centennial High School.
Ownership History
Date
Name
Owned For
Owner Type
Purchase Details
Closed on
May 15, 2018
Sold by
Kevin Allbritten R
Bought by
Sheber Lawrence and Hollingsworth Carole
Current Estimated Value
Purchase Details
Closed on
Jun 27, 2003
Sold by
Henson Felton J and Henson Hazel G
Bought by
Allbritten R K R and Allbritten Brenda
Home Financials for this Owner
Home Financials are based on the most recent Mortgage that was taken out on this home.
Original Mortgage
$200,000
Interest Rate
5.17%
Mortgage Type
New Conventional
Purchase Details
Closed on
Oct 30, 2001
Sold by
Mcclurkin Louie W
Bought by
Henson Felton J
Home Financials for this Owner
Home Financials are based on the most recent Mortgage that was taken out on this home.
Original Mortgage
$150,000
Interest Rate
6.85%
Mortgage Type
New Conventional
Create a Home Valuation Report for This Property
The Home Valuation Report is an in-depth analysis detailing your home's value as well as a comparison with similar homes in the area
Home Values in the Area
Average Home Value in this Area
Purchase History
| Date | Buyer | Sale Price | Title Company |
|---|---|---|---|
| Sheber Lawrence | $395,000 | -- | |
| Allbritten R K R | $290,000 | -- | |
| Henson Felton J | $254,000 | -- | |
| Henson Felton J | -- | -- |
Source: Public Records
Mortgage History
| Date | Status | Borrower | Loan Amount |
|---|---|---|---|
| Previous Owner | Allbritten R K R | $200,000 | |
| Previous Owner | Henson Felton J | $150,000 |
Source: Public Records
Tax History Compared to Growth
Tax History
| Year | Tax Paid | Tax Assessment Tax Assessment Total Assessment is a certain percentage of the fair market value that is determined by local assessors to be the total taxable value of land and additions on the property. | Land | Improvement |
|---|---|---|---|---|
| 2025 | $583 | $175,560 | $52,360 | $123,200 |
| 2023 | $4,761 | $168,680 | $42,400 | $126,280 |
| 2022 | $2,354 | $168,680 | $42,400 | $126,280 |
| 2021 | $465 | $153,240 | $31,120 | $122,120 |
| 2020 | $2,848 | $157,640 | $31,520 | $126,120 |
| 2019 | $484 | $154,840 | $30,960 | $123,880 |
| 2018 | $3,280 | $131,880 | $26,920 | $104,960 |
| 2017 | $2,300 | $90,760 | $19,720 | $71,040 |
| 2016 | $2,298 | $90,760 | $19,720 | $71,040 |
| 2015 | $2,691 | $90,760 | $19,720 | $71,040 |
| 2014 | $2,391 | $90,760 | $19,720 | $71,040 |
Source: Public Records
Map
Nearby Homes
- 10280 Crescent Ridge Dr
- 105 May Glen Way
- 485 Sheringham Ct
- 590 Sheringham Ct
- 435 Sheringham Terrace
- 10530 Haynes Forest Dr
- 3040 Roxburgh Dr
- 1095 Northpointe Trace
- 105 Laurel Mill Ct
- 780 Crab Orchard Dr
- 295 Crab Orchard Way
- 530 Kearny St
- 970 Laurel Mill Dr
- 615 Barrington Way
- 2020 Jardin Ct Unit 1
- 680 Barrington Way
- 500 Barrington Dr W
- 225 Wentworth Terrace
- 2570 Camden Glen Ct
- 2590 Camden Glen Ct
- 2560 Camden Glen Ct
- 2600 Camden Glen Ct
- 2550 Camden Glen Ct Unit 13
- 2610 Camden Glen Ct
- 2540 Camden Glen Ct
- 2620 Camden Glen Ct
- 2530 Camden Glen Ct Unit 13
- 2630 Camden Glen Ct
- 2520 Camden Glen Ct Unit 13
- 0 Camden Glen Ct
- 2545 Camden Glen Ct
- 2535 Camden Glen Ct Unit 13
- 2545 Camden Ct Unit 2545
- 2545 Camden Ct
- 2545 Camden Ct
- 2640 Camden Glen Ct Unit 13
- 2540 Roxburgh Dr
- 2555 Camden Glen Ct