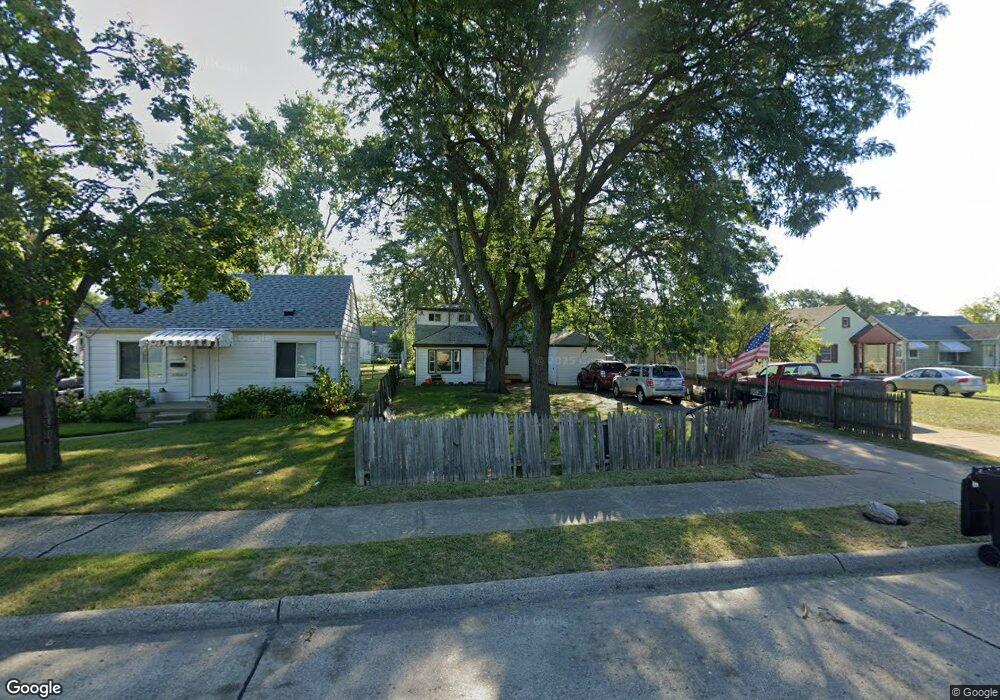
25802 Fern St Roseville, MI 48066
Estimated Value: $134,673 - $164,000
3
Beds
1
Bath
1,191
Sq Ft
$126/Sq Ft
Est. Value
About This Home
This home is located at 25802 Fern St, Roseville, MI 48066 and is currently estimated at $149,668, approximately $125 per square foot. 25802 Fern St is a home located in Macomb County with nearby schools including Dort Elementary School, Joseph G. Steenland Elementary School, and Fountain Elementary School.
Ownership History
Date
Name
Owned For
Owner Type
Purchase Details
Closed on
Jun 3, 2020
Sold by
Waddell Robert D
Bought by
Waddell Angela C
Current Estimated Value
Purchase Details
Closed on
Jan 28, 2016
Sold by
Waddell Angela C
Bought by
Waddell Angela C and Waddell Robert D
Purchase Details
Closed on
Jan 30, 2010
Sold by
Donovan Shaun and Secretary Of Housing & Urban D
Bought by
Waddell Angela C
Purchase Details
Closed on
Mar 26, 2009
Sold by
Gmac Mortgage Llc
Bought by
Secretary Of Housing & Urban Development
Purchase Details
Closed on
Feb 6, 2009
Sold by
Wilkes Crystal L
Bought by
Gmac Mortgage Llc
Purchase Details
Closed on
Oct 14, 2004
Sold by
Adriaens Arthur P and Smedley Theresa A
Bought by
Wilkes Crystal L
Purchase Details
Closed on
Jul 23, 1998
Sold by
Demattei Della F
Bought by
Adriaens Arthur P
Purchase Details
Closed on
Nov 22, 1996
Sold by
Schohl B and Schohl C
Bought by
Cottage J
Create a Home Valuation Report for This Property
The Home Valuation Report is an in-depth analysis detailing your home's value as well as a comparison with similar homes in the area
Home Values in the Area
Average Home Value in this Area
Purchase History
| Date | Buyer | Sale Price | Title Company |
|---|---|---|---|
| Waddell Angela C | -- | None Available | |
| Waddell Angela C | -- | Attorney | |
| Waddell Angela C | $10,000 | None Available | |
| Secretary Of Housing & Urban Development | -- | None Available | |
| Gmac Mortgage Llc | $121,260 | None Available | |
| Wilkes Crystal L | $94,000 | Metropolitan Title Company | |
| Adriaens Arthur P | $60,000 | -- | |
| Cottage J | $35,697 | -- |
Source: Public Records
Tax History Compared to Growth
Tax History
| Year | Tax Paid | Tax Assessment Tax Assessment Total Assessment is a certain percentage of the fair market value that is determined by local assessors to be the total taxable value of land and additions on the property. | Land | Improvement |
|---|---|---|---|---|
| 2025 | $2,553 | $57,600 | $0 | $0 |
| 2024 | $1,465 | $51,100 | $0 | $0 |
| 2023 | $1,786 | $44,900 | $0 | $0 |
| 2022 | $2,071 | $37,400 | $0 | $0 |
| 2021 | $2,011 | $34,400 | $0 | $0 |
| 2020 | $627 | $28,700 | $0 | $0 |
| 2019 | $876 | $25,800 | $0 | $0 |
| 2018 | $945 | $0 | $0 | $0 |
| 2017 | $882 | $19,634 | $6,212 | $13,422 |
| 2016 | $876 | $19,634 | $0 | $0 |
| 2015 | $637 | $17,177 | $0 | $0 |
| 2013 | -- | $19,033 | $0 | $0 |
| 2011 | -- | $23,365 | $0 | $0 |
Source: Public Records
Map
Nearby Homes
- 15738 Frazho Rd
- 15676 Frazho Rd
- 25673 Ford St
- 26204 Belanger St
- 25323 Fern St
- 25280 Dale St
- 25294 Wiseman St
- 26211 Clancy St
- 25239 Lehner St
- 26140 Nagel St
- 25270 Ford St
- 25289 Packard St
- 25143 Fern St
- 26070 Bryan St
- 26354 Dale Ct
- 25135 Dale St
- 25152 Leach St
- 26342 Grandmont St
- 16250 Guest Ct
- 25297 Fortuna St