J
Landlord's Agent in 2023
Jenny Han
Victory Realty, LLC
(703) 980-0115
2 in this area
36 Total Sales
Estimated Value: $710,129 - $748,000
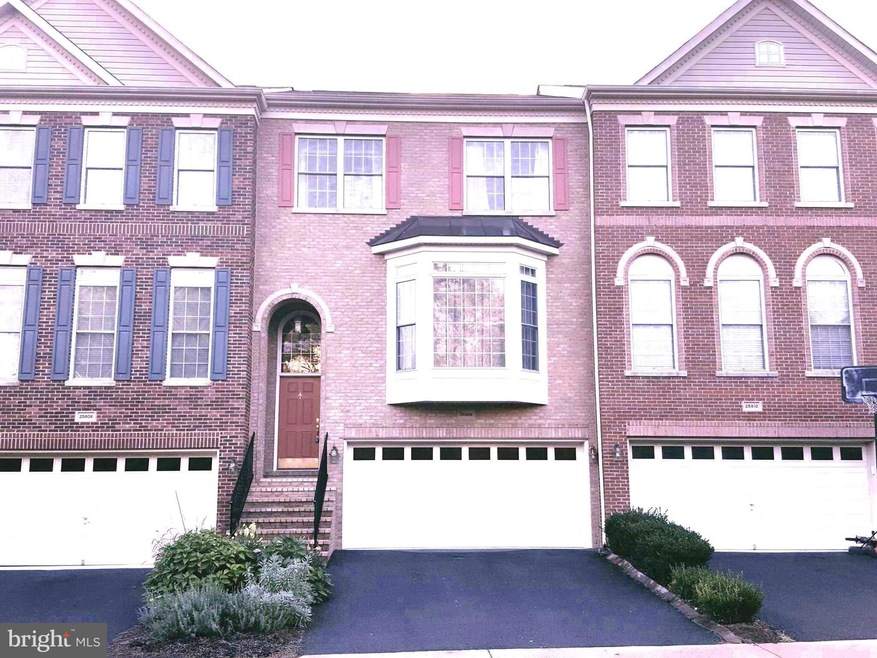
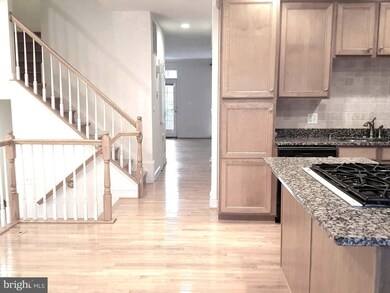
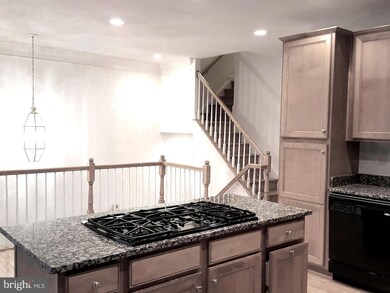
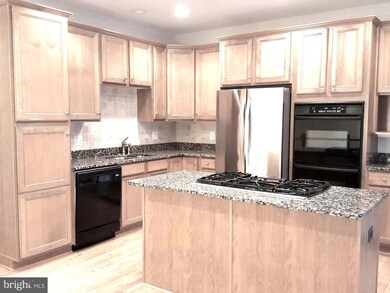
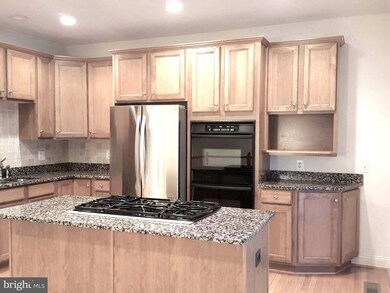
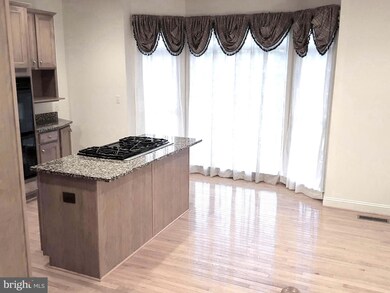
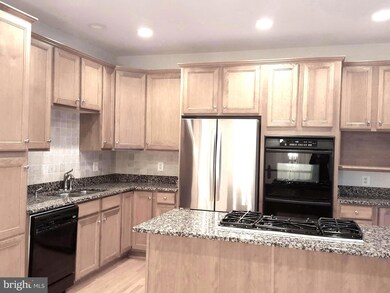
Beautiful Brick front over 2700 sqft 2 Car Garage town home. Hardwoods flooring throughout entire Main & Upper levels. Gourmet Kitchen with Granite Counters, Stainless Appliances, Double ovens, Upgraded cabinets. 9' Ceilings, Bump outs 3 level, Ceiling fans in BR, Deck & Fenced in back yard, Serene view of tree preserve area. Walk to Pool, Close to Shopping centers, Restaurants.
Last Agent to Rent the Property
(703) 942-8181 victoryrealtyjh@gmail.com Victory Realty, LLC License #0225080657 Listed on: 12/09/2022
Last Renter's Agent
(703) 266-3828 ki4homes@gmail.com Pacific Realty License #0225259592
| Date | Buyer | Sale Price | Title Company |
|---|---|---|---|
| Cho Ho Sang | -- | None Available | |
| Cho Sung S | $330,000 | -- | |
| Cho Jee-Yeon | $505,000 | -- |
| Date | Status | Borrower | Loan Amount |
|---|---|---|---|
| Open | Cho Sung S | $180,000 | |
| Previous Owner | Cho Jee-Yeon | $464,600 |
| Date | Event | Price | List to Sale | Price per Sq Ft |
|---|---|---|---|---|
| 01/21/2023 01/21/23 | Rented | $2,800 | 0.0% | -- |
| 01/09/2023 01/09/23 | Under Contract | -- | -- | -- |
| 12/09/2022 12/09/22 | For Rent | $2,800 | +12.0% | -- |
| 03/11/2021 03/11/21 | Rented | $2,500 | 0.0% | -- |
| 03/09/2021 03/09/21 | For Rent | $2,500 | 0.0% | -- |
| 03/07/2021 03/07/21 | Off Market | $2,500 | -- | -- |
| 03/03/2021 03/03/21 | For Rent | $2,500 | +8.7% | -- |
| 02/20/2019 02/20/19 | Rented | $2,300 | 0.0% | -- |
| 02/08/2019 02/08/19 | For Rent | $2,300 | +4.5% | -- |
| 10/05/2017 10/05/17 | Rented | $2,200 | 0.0% | -- |
| 09/15/2017 09/15/17 | Under Contract | -- | -- | -- |
| 09/14/2017 09/14/17 | For Rent | $2,200 | -- | -- |
| Year | Tax Paid | Tax Assessment Tax Assessment Total Assessment is a certain percentage of the fair market value that is determined by local assessors to be the total taxable value of land and additions on the property. | Land | Improvement |
|---|---|---|---|---|
| 2025 | $5,639 | $700,510 | $215,000 | $485,510 |
| 2024 | $5,752 | $665,000 | $200,000 | $465,000 |
| 2023 | $5,274 | $602,790 | $200,000 | $402,790 |
| 2022 | $5,264 | $591,460 | $190,000 | $401,460 |
| 2021 | $5,206 | $531,260 | $155,000 | $376,260 |
| 2020 | $5,049 | $487,850 | $135,000 | $352,850 |
| 2019 | $4,786 | $458,020 | $135,000 | $323,020 |
| 2018 | $4,836 | $445,750 | $125,000 | $320,750 |
| 2017 | $4,720 | $419,580 | $125,000 | $294,580 |
| 2016 | $4,670 | $407,880 | $0 | $0 |
| 2015 | $4,443 | $276,440 | $0 | $276,440 |
| 2014 | $4,517 | $276,100 | $0 | $276,100 |
J
Landlord's Agent in 2023
Jenny Han
Victory Realty, LLC
(703) 980-0115
2 in this area
36 Total Sales

Tenant's Agent in 2023
Hayley Park
Pacific Realty
(571) 436-0308
12 Total Sales
Buyer's Agent in 2021
Bonnie Ferris
Samson Properties
(540) 219-9054
6 Total Sales
Buyer's Agent in 2019
John J. Martinich
EXP Realty, LLC
(703) 988-1288
2 in this area
108 Total Sales
Buyer's Agent in 2017
Maria Georgiev
Samson Properties
(425) 445-6730
3 in this area
35 Total Sales
Source: Bright MLS
MLS Number: VALO2040950
APN: 166-20-8088
Disclaimer: Certain information contained herein is derived from information provided by parties other than Homes.com. All information provided is deemed reliable, but is not guaranteed to be accurate and should be independently verified.
![]() The data relating to real estate for sale on this website appears in part through the BRIGHT Internet Data Exchange program, a voluntary cooperative exchange of property listing data between licensed real estate brokerage firms, and is provided by BRIGHT through a licensing agreement.
The data relating to real estate for sale on this website appears in part through the BRIGHT Internet Data Exchange program, a voluntary cooperative exchange of property listing data between licensed real estate brokerage firms, and is provided by BRIGHT through a licensing agreement.
Listing information is from various brokers who participate in the Bright MLS IDX program and not all listings may be visible on the site.
The property information being provided on or through the website is for the personal, non-commercial use of consumers and such information may not be used for any purpose other than to identify prospective properties consumers may be interested in purchasing.
Some properties which appear for sale on the website may no longer be available because they are for instance, under contract, sold or are no longer being offered for sale.
Property information displayed is deemed reliable but is not guaranteed.
Copyright 2026 Bright MLS, Inc.
Ask me questions while you tour the home.