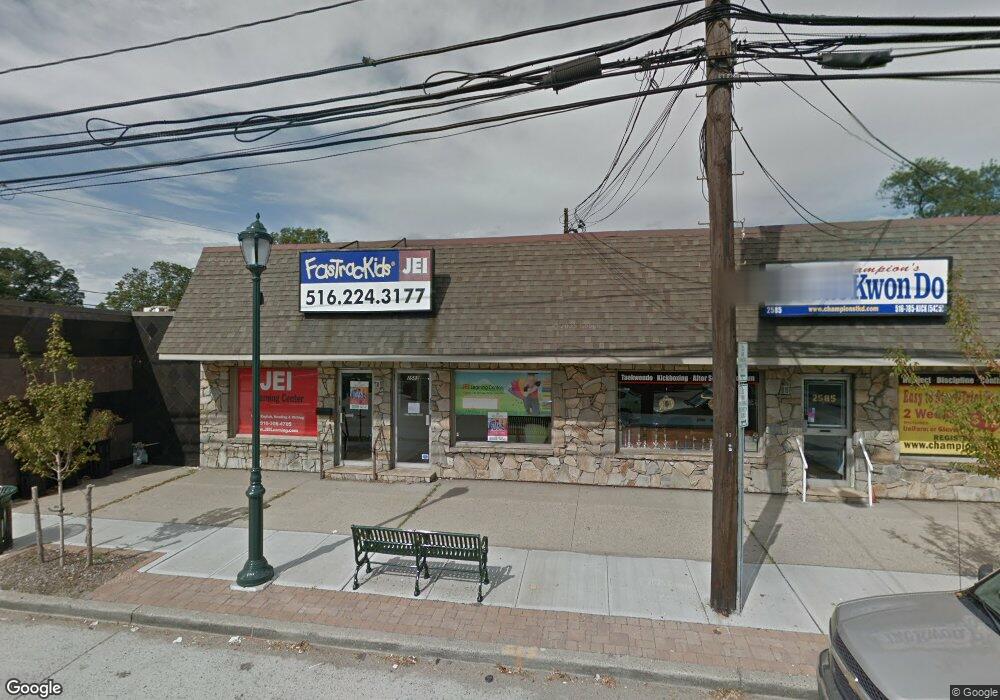
2581 Merrick Rd Bellmore, NY 11710
Estimated Value: $1,085,000
--
Bed
--
Bath
3,510
Sq Ft
$309/Sq Ft
Est. Value
About This Home
This home is located at 2581 Merrick Rd, Bellmore, NY 11710 and is currently estimated at $1,085,000, approximately $309 per square foot. 2581 Merrick Rd is a home located in Nassau County with nearby schools including Lt. General Thomas P. Stafford Elementary School, Winthrop Avenue School, and Shore Road School.
Ownership History
Date
Name
Owned For
Owner Type
Purchase Details
Closed on
Mar 21, 2016
Sold by
31 New York Avenue Llc
Bought by
2581 2585 Merrick Road Llc
Current Estimated Value
Home Financials for this Owner
Home Financials are based on the most recent Mortgage that was taken out on this home.
Original Mortgage
$350,000
Outstanding Balance
$277,023
Interest Rate
3.65%
Mortgage Type
Commercial
Estimated Equity
$807,977
Purchase Details
Closed on
Jan 3, 2006
Sold by
Merrick Rd Bellmore Llc
Bought by
31 New York Avenue Llc
Purchase Details
Closed on
Aug 12, 2004
Sold by
K & A Realty Corp
Bought by
Merrick Rd - Bellmore Llc
Purchase Details
Closed on
Aug 6, 2004
Sold by
Bapis Helen
Purchase Details
Closed on
Oct 12, 1995
Sold by
Karipidis Mary and Amanatides Alex
Bought by
K & A Realty Corp
Create a Home Valuation Report for This Property
The Home Valuation Report is an in-depth analysis detailing your home's value as well as a comparison with similar homes in the area
Home Values in the Area
Average Home Value in this Area
Purchase History
| Date | Buyer | Sale Price | Title Company |
|---|---|---|---|
| 2581 2585 Merrick Road Llc | -- | Fidelity National Title Insu | |
| 31 New York Avenue Llc | $750,000 | -- | |
| Merrick Rd - Bellmore Llc | $550,000 | -- | |
| -- | -- | -- | |
| K & A Realty Corp | -- | -- |
Source: Public Records
Mortgage History
| Date | Status | Borrower | Loan Amount |
|---|---|---|---|
| Open | 2581 2585 Merrick Road Llc | $350,000 |
Source: Public Records
Tax History Compared to Growth
Tax History
| Year | Tax Paid | Tax Assessment Tax Assessment Total Assessment is a certain percentage of the fair market value that is determined by local assessors to be the total taxable value of land and additions on the property. | Land | Improvement |
|---|---|---|---|---|
| 2025 | $32,945 | $3,591 | $2,358 | $1,233 |
| 2024 | $10,551 | $3,936 | $2,584 | $1,352 |
| 2023 | $38,219 | $4,426 | $2,906 | $1,520 |
| 2022 | $35,690 | $4,426 | $2,906 | $1,520 |
| 2021 | $33,596 | $4,958 | $2,906 | $2,052 |
| 2020 | $32,826 | $3,044 | $2,116 | $928 |
| 2019 | $10,881 | $3,044 | $2,116 | $928 |
| 2018 | $18,898 | $5,244 | $0 | $0 |
| 2017 | $34,321 | $5,244 | $3,645 | $1,599 |
| 2016 | $52,071 | $5,244 | $3,645 | $1,599 |
| 2015 | $15,030 | $5,244 | $3,645 | $1,599 |
| 2014 | $15,030 | $5,244 | $3,645 | $1,599 |
| 2013 | $14,078 | $5,244 | $3,645 | $1,599 |
Source: Public Records
Map
Nearby Homes
- 2398 Centre Ave
- 2460 Centre Ave
- 732 Sunrise Ave
- 601 Hughes St
- 2325 Centre Ave
- 2490 Orange St
- 308 Saint Marks Ave
- 2573 Legion St
- 2492 Lefferts Place
- 201 Argyle Place
- 2542 Lefferts Place
- 107 1st Place
- 119 Ocean Ave
- No# Clarendon Ave
- 14 Bell Ct
- 906 Ardmore Place
- 2726 Clarendon Ave
- 199 Claxton Ave
- 2476 Florin Ct
- 2545 Horace Ct
- 2583 Merrick Rd
- 609 Prospect Place
- 2578 Merrick Rd
- 2601 Merrick Rd
- 2601 Merrick Rd
- 2413 Prospect Place
- 2576 Merrick Rd
- 2572 Merrick Rd Unit C
- 2572 Merrick Rd Unit 2
- 2572 Merrick Rd
- 2572 Merrick Rd Unit B
- 2412 Centre Ave
- 305 Hughes St
- 309 Hughes St
- 307 Hughes St
- 2447 Prospect Place
- 2600 Hughes St
- 2410 Prospect Place
- 401 Hughes St
- 2549 Merrick Rd