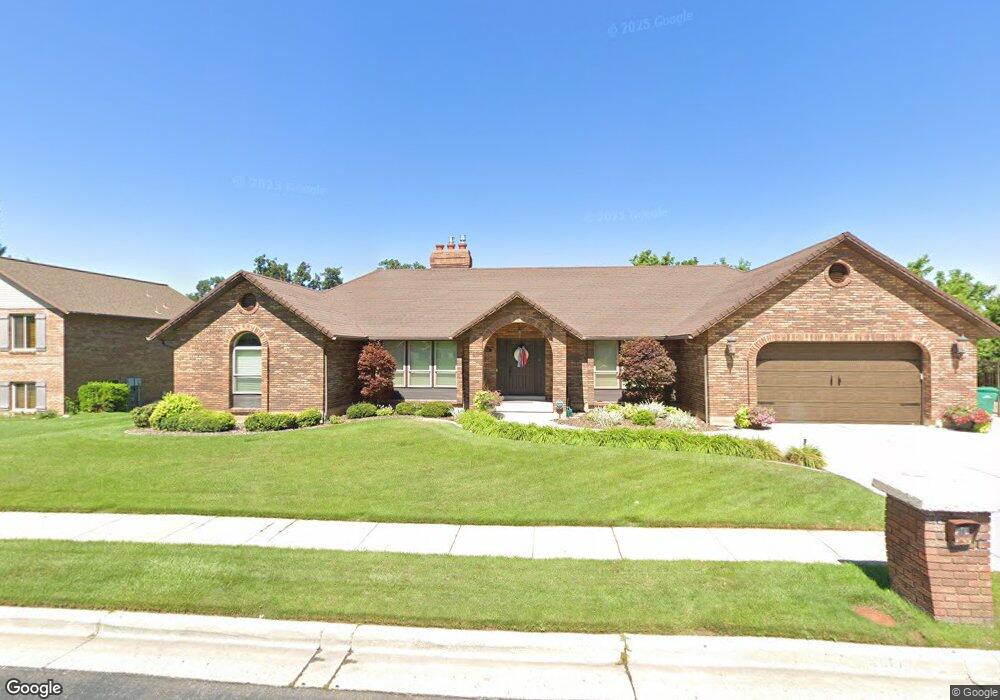
2581 N 2300 E Layton, UT 84040
Estimated Value: $644,000 - $722,153
6
Beds
3
Baths
4,170
Sq Ft
$164/Sq Ft
Est. Value
About This Home
This home is located at 2581 N 2300 E, Layton, UT 84040 and is currently estimated at $682,538, approximately $163 per square foot. 2581 N 2300 E is a home located in Davis County with nearby schools including Sarah Jane Adams Elementary School, North Layton Junior High School, and Northridge High School.
Ownership History
Date
Name
Owned For
Owner Type
Purchase Details
Closed on
Oct 12, 2022
Sold by
Williams Carrll W
Bought by
Rex T & Carrie W Williams Family Trust
Current Estimated Value
Purchase Details
Closed on
Nov 18, 2005
Sold by
Layton R Dean and Layton Lynn J
Bought by
Williams Rex T and Williams Carrie
Home Financials for this Owner
Home Financials are based on the most recent Mortgage that was taken out on this home.
Original Mortgage
$39,000
Interest Rate
5.93%
Mortgage Type
Credit Line Revolving
Purchase Details
Closed on
May 6, 2005
Sold by
Winward Richard B and Winward Parline K
Bought by
Layton R Dean and Layton Lynn J
Purchase Details
Closed on
Aug 13, 1997
Sold by
Willey Richard J and Willey Colleen K
Bought by
Winward Richard B and Winward Pauline K
Purchase Details
Closed on
Mar 29, 1996
Sold by
Willey Richard J and Willey Colleen K
Bought by
Winward Richard B and Winward Pauline K
Create a Home Valuation Report for This Property
The Home Valuation Report is an in-depth analysis detailing your home's value as well as a comparison with similar homes in the area
Home Values in the Area
Average Home Value in this Area
Purchase History
| Date | Buyer | Sale Price | Title Company |
|---|---|---|---|
| Rex T & Carrie W Williams Family Trust | -- | -- | |
| Williams Rex T | -- | Backman Title Services | |
| Layton R Dean | -- | None Available | |
| Winward Richard B | -- | -- | |
| Winward Richard B | -- | Bonneville Title Company Inc |
Source: Public Records
Mortgage History
| Date | Status | Borrower | Loan Amount |
|---|---|---|---|
| Previous Owner | Williams Rex T | $39,000 | |
| Previous Owner | Williams Rex T | $263,920 |
Source: Public Records
Tax History
| Year | Tax Paid | Tax Assessment Tax Assessment Total Assessment is a certain percentage of the fair market value that is determined by local assessors to be the total taxable value of land and additions on the property. | Land | Improvement |
|---|---|---|---|---|
| 2025 | $3,607 | $348,700 | $157,984 | $190,716 |
| 2024 | $3,415 | $334,950 | $174,992 | $159,958 |
| 2023 | $3,458 | $605,000 | $222,964 | $382,036 |
| 2022 | $3,601 | $344,300 | $120,712 | $223,588 |
| 2021 | $3,242 | $461,000 | $185,511 | $275,489 |
| 2020 | $2,954 | $402,000 | $157,559 | $244,441 |
| 2019 | $2,888 | $387,000 | $139,133 | $247,867 |
| 2018 | $2,684 | $361,000 | $114,235 | $246,765 |
| 2016 | $2,458 | $173,360 | $58,869 | $114,491 |
| 2015 | $2,418 | $162,965 | $58,869 | $104,096 |
| 2014 | $2,229 | $154,341 | $58,869 | $95,472 |
| 2013 | -- | $162,001 | $36,463 | $125,538 |
Source: Public Records
Map
Nearby Homes
- 2597 N 2300 E
- 2353 Canyon View Dr
- 2340 N 2050 E
- 2563 E 2250 N
- 1935 Deere Valley Dr
- 1911 Deere Valley Dr
- 2273 N 1975 E
- 2569 N 2900 E
- 1785 E 2825 N
- 2189 N 1950 E
- 1731 E 2825 N
- 2136 N 2800 E
- 1960 N 2150 E
- 1821 E Whitetail Way
- 3232 N Redtail Way
- 3142 E Thorley Dr
- 3138 E Thorley Dr
- 1954 N 2600 E
- 1827 E Whitetail Dr
- 2509 E 1900 N
Your Personal Tour Guide
Ask me questions while you tour the home.