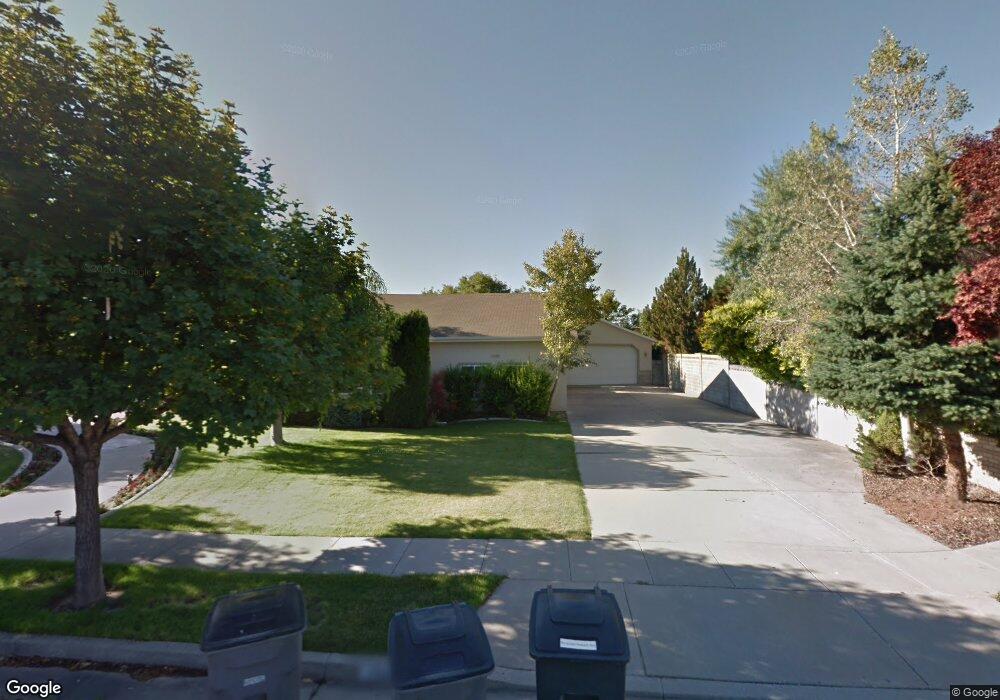
2581 Royalty Ln South Jordan, UT 84095
Estimated Value: $799,000 - $963,000
3
Beds
3
Baths
2,353
Sq Ft
$374/Sq Ft
Est. Value
About This Home
This home is located at 2581 Royalty Ln, South Jordan, UT 84095 and is currently estimated at $879,967, approximately $373 per square foot. 2581 Royalty Ln is a home located in Salt Lake County with nearby schools including Jordan Ridge School, South Jordan Middle School, and Hawthorn Academy.
Ownership History
Date
Name
Owned For
Owner Type
Purchase Details
Closed on
Sep 18, 2020
Sold by
Ross Randall D
Bought by
Ross Randall David
Current Estimated Value
Home Financials for this Owner
Home Financials are based on the most recent Mortgage that was taken out on this home.
Original Mortgage
$432,680
Outstanding Balance
$383,975
Interest Rate
2.9%
Mortgage Type
New Conventional
Estimated Equity
$495,992
Purchase Details
Closed on
Jul 20, 2020
Sold by
Ross Alisa R
Bought by
Ross Randall D
Home Financials for this Owner
Home Financials are based on the most recent Mortgage that was taken out on this home.
Original Mortgage
$432,680
Outstanding Balance
$383,975
Interest Rate
2.9%
Mortgage Type
New Conventional
Estimated Equity
$495,992
Purchase Details
Closed on
Aug 6, 2007
Sold by
The Martin & Cheri Gonzales Trust and Gonzales Martin T
Bought by
Ross Randall D and Ross Alisa R
Home Financials for this Owner
Home Financials are based on the most recent Mortgage that was taken out on this home.
Original Mortgage
$79,500
Interest Rate
6.34%
Mortgage Type
Stand Alone Second
Purchase Details
Closed on
Jul 8, 2002
Sold by
Gonzales Martin T and Gonzales Cheri P
Bought by
Gonzales Martin T and Gonzales Cheri P
Create a Home Valuation Report for This Property
The Home Valuation Report is an in-depth analysis detailing your home's value as well as a comparison with similar homes in the area
Home Values in the Area
Average Home Value in this Area
Purchase History
| Date | Buyer | Sale Price | Title Company |
|---|---|---|---|
| Ross Randall David | -- | Meridian Title | |
| Ross Randall D | -- | Meridian Title | |
| Ross Randall D | -- | Backman Title Services | |
| Gonzales Martin T | -- | -- |
Source: Public Records
Mortgage History
| Date | Status | Borrower | Loan Amount |
|---|---|---|---|
| Open | Ross Randall David | $432,680 | |
| Closed | Ross Randall D | $79,500 | |
| Closed | Ross Randall D | $424,000 |
Source: Public Records
Tax History Compared to Growth
Tax History
| Year | Tax Paid | Tax Assessment Tax Assessment Total Assessment is a certain percentage of the fair market value that is determined by local assessors to be the total taxable value of land and additions on the property. | Land | Improvement |
|---|---|---|---|---|
| 2025 | $4,309 | $865,400 | $328,800 | $536,600 |
| 2024 | $4,309 | $818,100 | $307,400 | $510,700 |
| 2023 | $4,366 | $782,200 | $301,400 | $480,800 |
| 2022 | $4,582 | $804,600 | $295,500 | $509,100 |
| 2021 | $3,834 | $617,700 | $242,300 | $375,400 |
| 2020 | $3,601 | $543,800 | $226,900 | $316,900 |
| 2019 | $3,589 | $532,800 | $226,900 | $305,900 |
| 2018 | $3,404 | $502,700 | $142,700 | $360,000 |
| 2017 | $3,270 | $473,300 | $142,700 | $330,600 |
| 2016 | $3,258 | $446,900 | $142,700 | $304,200 |
| 2015 | $3,215 | $428,800 | $156,300 | $272,500 |
| 2014 | $3,005 | $393,800 | $145,400 | $248,400 |
Source: Public Records
Map
Nearby Homes
- 2551 W Winding Way
- 2246 Country Bend Dr Unit 25
- 2439 Bridle Oak Dr
- 1967 W 9350 S
- 9294 S 2700 W
- 2375 Bonanza Way
- 2097 Jordan Villa Dr
- 9178 Lisa Ave
- 2883 Jana Lee Dr
- 2177 W 9240 S
- 9414 S 1980 W
- 9496 S 1930 W
- 2116 W Abbey View Rd
- 2223 W Williamsburg Cir
- 2286 Williamsburg Cir
- 3256 Star Fire Rd
- 2636 W 9110 S
- 1558 W Banner Dr Unit 805
- 1574 W Banner Dr Unit 743
- 1556 W Banner Dr Unit 806
- 2599 Royalty Ln
- 2561 Countess Way
- 9657 Royalty Ln
- 9654 Countess Way
- 9672 Royalty Ln
- 2554 Windsor Manor Ct
- 9656 Royalty Ln
- 9641 Royalty Ln
- 2546 Windsor Manor Ct
- 9644 Countess Way
- 2541 Countess Way
- 9673 Princess Cove
- 9671 Countess Way
- 9642 Royalty Ln
- 9683 Princess Cove
- 9653 S Countess Way
- 9653 Countess Way
- 2526 W Windsor Manor Ct
- 2526 Windsor Manor Ct
- 9659 Princess Cove