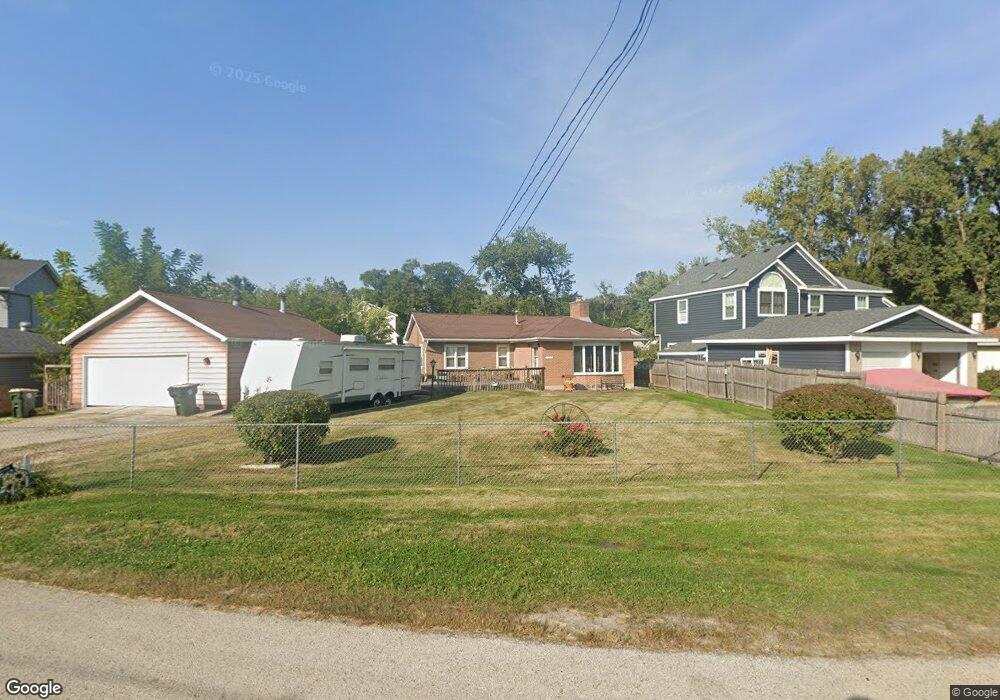
25810 W Andrew Ct Unit 2 Ingleside, IL 60041
Estimated Value: $255,767 - $301,000
--
Bed
1
Bath
1,195
Sq Ft
$228/Sq Ft
Est. Value
About This Home
This home is located at 25810 W Andrew Ct Unit 2, Ingleside, IL 60041 and is currently estimated at $272,692, approximately $228 per square foot. 25810 W Andrew Ct Unit 2 is a home located in Lake County with nearby schools including Gavin Central Elementary School, Gavin South Middle School, and Grant Community High School.
Ownership History
Date
Name
Owned For
Owner Type
Purchase Details
Closed on
Jan 31, 2020
Sold by
Wells Shirley and Wells Billy
Bought by
Wells Shirley and Green Tammy
Current Estimated Value
Purchase Details
Closed on
Apr 22, 2005
Sold by
Wells Billy J
Bought by
Wells Billy J and Wells Shirley A
Home Financials for this Owner
Home Financials are based on the most recent Mortgage that was taken out on this home.
Original Mortgage
$200,000
Outstanding Balance
$71,862
Interest Rate
1.2%
Mortgage Type
Negative Amortization
Estimated Equity
$200,830
Purchase Details
Closed on
Oct 24, 1995
Sold by
Rithamel Tom Clifford and Oehler Dorlene Ann
Bought by
Wells Billy J
Home Financials for this Owner
Home Financials are based on the most recent Mortgage that was taken out on this home.
Original Mortgage
$115,200
Interest Rate
7.65%
Create a Home Valuation Report for This Property
The Home Valuation Report is an in-depth analysis detailing your home's value as well as a comparison with similar homes in the area
Home Values in the Area
Average Home Value in this Area
Purchase History
| Date | Buyer | Sale Price | Title Company |
|---|---|---|---|
| Wells Shirley | -- | None Available | |
| Wells Billy J | -- | Stewart Title Guaranty Compa | |
| Wells Billy J | $128,000 | Chicago Title Insurance Co |
Source: Public Records
Mortgage History
| Date | Status | Borrower | Loan Amount |
|---|---|---|---|
| Open | Wells Billy J | $200,000 | |
| Closed | Wells Billy J | $115,200 |
Source: Public Records
Tax History Compared to Growth
Tax History
| Year | Tax Paid | Tax Assessment Tax Assessment Total Assessment is a certain percentage of the fair market value that is determined by local assessors to be the total taxable value of land and additions on the property. | Land | Improvement |
|---|---|---|---|---|
| 2024 | $4,296 | $80,287 | $14,188 | $66,099 |
| 2023 | $4,888 | $71,344 | $13,366 | $57,978 |
| 2022 | $4,888 | $72,553 | $13,494 | $59,059 |
| 2021 | $4,135 | $61,769 | $12,719 | $49,050 |
| 2020 | $4,151 | $60,886 | $12,537 | $48,349 |
| 2019 | $3,991 | $58,387 | $12,022 | $46,365 |
| 2018 | $4,259 | $60,710 | $18,855 | $41,855 |
| 2017 | $4,235 | $56,115 | $17,428 | $38,687 |
| 2016 | $4,711 | $51,321 | $15,939 | $35,382 |
| 2015 | $4,895 | $47,892 | $14,874 | $33,018 |
| 2014 | $5,364 | $52,586 | $14,630 | $37,956 |
| 2012 | $5,802 | $57,899 | $17,399 | $40,500 |
Source: Public Records
Map
Nearby Homes
- 36497 N Hawthorne Ln
- 36391 N Tamarack Dr
- 36379 N Wesley Rd
- 37322 N Stanton Point Rd
- 35835 N Benjamin Ave
- 35720 N Laurel Ave
- 35729 N Watson Ave
- 35706 N Benjamin Ave
- 35694 N Laurel Ave
- 69 Washington St
- 314 Mastodon Dr
- 35663 N Helendale Rd
- 42 Rushmore Rd
- 605 Rollins Rd
- 24570 W Blackcherry Ln
- 43 Lippincott Rd
- 24731 W Orchard Place
- 35647 N Grove Ave
- 26177 W Lakeview Ave
- 35611 N Grove Ave
- 25790 W Andrew Ct
- 25822 W Andrew Ct Unit 2
- 25778 W Andrew Ct
- 36792 N Hickory Ct
- 25825 W Andrew Ct Unit 2
- 36794 N Hickory Ct
- 25811 W Andrew Ct
- 36786 N Hickory Ct Unit 2
- 25766 W Andrew Ct
- 25826 W Andrew Ct
- 25797 W Andrew Ct
- 25769 W Andrew Ct
- 25781 W Andrew Ct
- 36774 N Hickory Ct
- 36796 N Hickory Ct
- 34983 N Hickory Ct
- 36802 N Hickory Ct
- 36812 N Hickory Ct
- 36825 N Hickory Ct
- 25774 W Brodie Dr