Estimated Value: $377,000 - $398,000
4
Beds
2
Baths
1,656
Sq Ft
$233/Sq Ft
Est. Value
About This Home
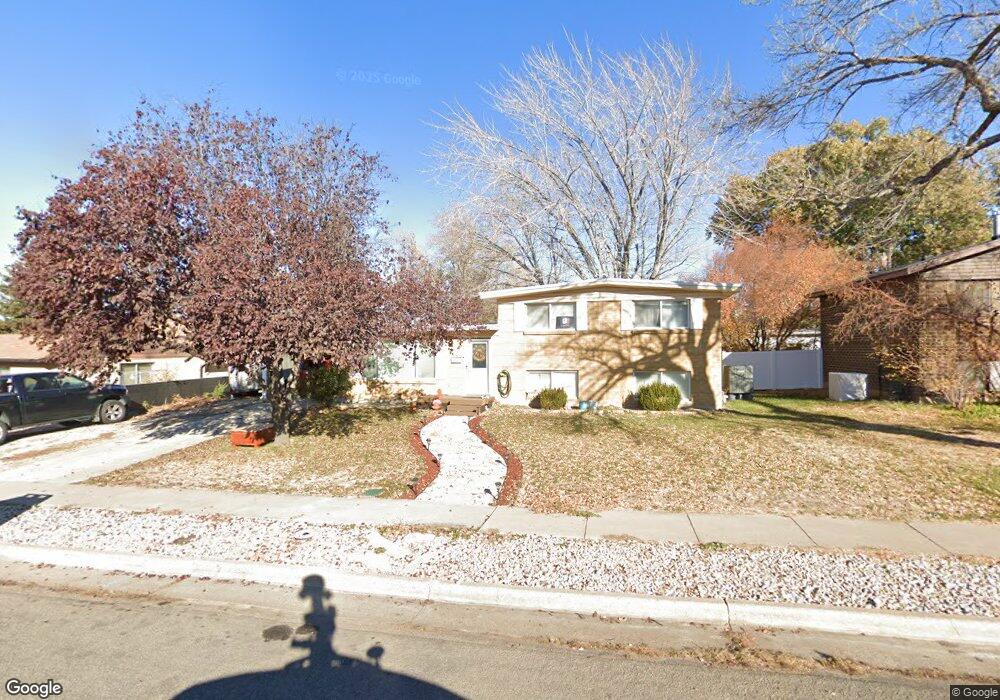
This home is located at 2582 W 5700 S, Roy, UT 84067 and is currently estimated at $385,743, approximately $232 per square foot. 2582 W 5700 S is a home located in Weber County with nearby schools including Roy Elementary School, Roy Junior High School, and Roy High School.
Ownership History
Date
Name
Owned For
Owner Type
Purchase Details
Closed on
Jun 27, 2007
Sold by
Gannon Joseph
Bought by
Staheli Dustin K and Staheli Natalie S
Current Estimated Value
Home Financials for this Owner
Home Financials are based on the most recent Mortgage that was taken out on this home.
Original Mortgage
$7,700
Outstanding Balance
$4,739
Interest Rate
6.21%
Mortgage Type
Stand Alone Second
Estimated Equity
$381,004
Purchase Details
Closed on
Jun 25, 1997
Sold by
Rovira Shelly and Tolman Vicky
Bought by
Gannon Joseph
Home Financials for this Owner
Home Financials are based on the most recent Mortgage that was taken out on this home.
Original Mortgage
$115,184
Interest Rate
7.91%
Mortgage Type
FHA
Purchase Details
Closed on
Aug 29, 1996
Sold by
Armstrong Nancy L
Bought by
Rovira Shelly and Tolman Vicky
Home Financials for this Owner
Home Financials are based on the most recent Mortgage that was taken out on this home.
Original Mortgage
$74,450
Interest Rate
8.23%
Mortgage Type
FHA
Create a Home Valuation Report for This Property
The Home Valuation Report is an in-depth analysis detailing your home's value as well as a comparison with similar homes in the area
Home Values in the Area
Average Home Value in this Area
Purchase History
| Date | Buyer | Sale Price | Title Company |
|---|---|---|---|
| Staheli Dustin K | -- | Backman | |
| Gannon Joseph | -- | Associated Title | |
| Rovira Shelly | -- | Associated Title |
Source: Public Records
Mortgage History
| Date | Status | Borrower | Loan Amount |
|---|---|---|---|
| Open | Staheli Dustin K | $7,700 | |
| Open | Staheli Dustin K | $144,952 | |
| Previous Owner | Gannon Joseph | $115,184 | |
| Previous Owner | Rovira Shelly | $74,450 |
Source: Public Records
Tax History Compared to Growth
Tax History
| Year | Tax Paid | Tax Assessment Tax Assessment Total Assessment is a certain percentage of the fair market value that is determined by local assessors to be the total taxable value of land and additions on the property. | Land | Improvement |
|---|---|---|---|---|
| 2025 | $2,434 | $382,562 | $115,084 | $267,478 |
| 2024 | $2,352 | $204,599 | $63,306 | $141,293 |
| 2023 | $2,149 | $185,900 | $59,094 | $126,806 |
| 2022 | $2,396 | $216,150 | $56,726 | $159,424 |
| 2021 | $1,816 | $266,000 | $67,293 | $198,707 |
| 2020 | $1,690 | $227,000 | $67,293 | $159,707 |
| 2019 | $1,392 | $199,000 | $41,829 | $157,171 |
| 2018 | $1,235 | $167,000 | $36,842 | $130,158 |
| 2017 | $1,162 | $148,000 | $36,842 | $111,158 |
| 2016 | $1,066 | $73,172 | $19,913 | $53,259 |
| 2015 | $938 | $66,380 | $22,658 | $43,722 |
| 2014 | $933 | $65,275 | $17,131 | $48,144 |
Source: Public Records
Map
Nearby Homes
- 2571 W 5725 S
- 2646 W 5625 S Unit M-2646
- 2587 W 5750 S
- 2672 W 5750 S
- 5810 S 2550 W
- 2778 W 5550 S Unit 28
- 5568 S 2800 W Unit 5B
- 2786 W 5550 S Unit C11
- 5643 S 2200 W
- 2778 W 5400 S
- 5317 S 2690 W
- 2907 W 5775 S
- 5326 S 2675 W
- 2829 W 5925 S
- 5345 S 2425 W
- 2995 W 5750 S
- 5573 S 2150 W
- 2184 W 5500 S
- 2146 W 5600 S Unit 29
- 5545 S 2100 W Unit 12
- 5680 S 2600 W
- 5680 S 2600 W Unit 12
- 2574 W 5700 S
- 2583 W 5650 S
- 2577 W 5650 S
- 5660 S 2600 W
- 2583 W 5700 S
- 2567 W 5700 S
- 5663 S 2600 W
- 5677 S 2600 W
- 5691 S 2600 W
- 5705 S 2600 W
- 2570 W 5650 S Unit 3
- 2570 W 5650 S Unit 1
- 2570 W 5650 S
- 2564 W 5650 S
- 5709 S 2550 W
- 5688 S 2550 W
- 2584 W 5725 S
- 5715 S 2600 W