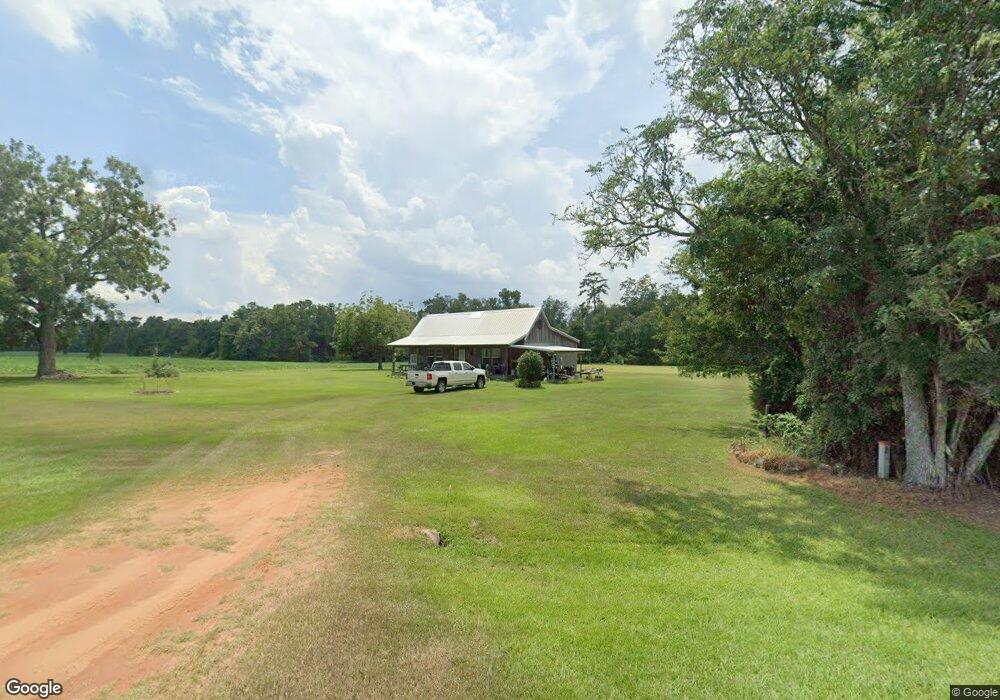
2583 Fountain Bridge Rd Morgan, GA 39866
Estimated Value: $381,000 - $537,323
2
Beds
1
Bath
1,334
Sq Ft
$344/Sq Ft
Est. Value
About This Home
This home is located at 2583 Fountain Bridge Rd, Morgan, GA 39866 and is currently estimated at $459,162, approximately $344 per square foot. 2583 Fountain Bridge Rd is a home located in Calhoun County with nearby schools including Calhoun County Elementary School, Calhoun County Middle School, and Calhoun County High School.
Ownership History
Date
Name
Owned For
Owner Type
Purchase Details
Closed on
Jul 21, 2023
Sold by
Mclendon Danny
Bought by
White Shannon E and White Joshua D
Current Estimated Value
Purchase Details
Closed on
Dec 28, 2009
Sold by
Sims Dan
Bought by
Grogan John J and Sims Brian D
Purchase Details
Closed on
May 15, 2007
Sold by
Nix Donley Melba
Bought by
Mclendon Danny and Mclendon Melba Nix
Purchase Details
Closed on
Mar 12, 2007
Sold by
Donley Melba Nix
Bought by
Mclendon Danny L
Purchase Details
Closed on
Dec 6, 1983
Sold by
Donley Melba Nix
Bought by
Donley Melba Nix
Create a Home Valuation Report for This Property
The Home Valuation Report is an in-depth analysis detailing your home's value as well as a comparison with similar homes in the area
Home Values in the Area
Average Home Value in this Area
Purchase History
| Date | Buyer | Sale Price | Title Company |
|---|---|---|---|
| White Shannon E | -- | -- | |
| Grogan John J | -- | -- | |
| Mclendon Danny | -- | -- | |
| Mclendon Danny L | -- | -- | |
| Donley Melba Nix | -- | -- |
Source: Public Records
Tax History Compared to Growth
Tax History
| Year | Tax Paid | Tax Assessment Tax Assessment Total Assessment is a certain percentage of the fair market value that is determined by local assessors to be the total taxable value of land and additions on the property. | Land | Improvement |
|---|---|---|---|---|
| 2025 | $2,733 | $113,020 | $71,131 | $41,889 |
| 2024 | $2,691 | $113,020 | $71,131 | $41,889 |
| 2023 | $2,033 | $113,020 | $71,131 | $41,889 |
| 2022 | $2,584 | $112,820 | $71,131 | $41,689 |
| 2021 | $2,472 | $108,351 | $71,131 | $37,220 |
| 2020 | $3,924 | $108,351 | $71,131 | $37,220 |
| 2019 | $2,639 | $109,726 | $71,131 | $38,595 |
| 2018 | $2,285 | $109,726 | $71,131 | $38,595 |
| 2017 | $3,446 | $108,604 | $70,009 | $38,595 |
| 2016 | $1,597 | $94,668 | $70,009 | $24,659 |
| 2015 | -- | $71,770 | $70,009 | $1,761 |
| 2014 | -- | $73,841 | $71,864 | $1,978 |
| 2013 | -- | $73,842 | $71,863 | $1,979 |
Source: Public Records
Map
Nearby Homes