2583 Haas Dr Allegan, MI 49010
Estimated Value: $383,000 - $494,000
2
Beds
3
Baths
1,352
Sq Ft
$327/Sq Ft
Est. Value
About This Home
This home is located at 2583 Haas Dr, Allegan, MI 49010 and is currently estimated at $442,053, approximately $326 per square foot. 2583 Haas Dr is a home located in Allegan County with nearby schools including North Ward Elementary School, L.E. White Middle School, and Allegan High School.
Ownership History
Date
Name
Owned For
Owner Type
Purchase Details
Closed on
May 9, 2023
Sold by
Akker James Vanden and Akker Jeanette H
Bought by
Vandenakker Revocable Trust
Current Estimated Value
Purchase Details
Closed on
Nov 23, 2009
Sold by
Vanden Akker Edwin M
Bought by
Vanden Akker Edwin M and Vanden Akker James
Purchase Details
Closed on
Sep 22, 2008
Sold by
Akker Edwin Vanden and Edwin Vanden Akker Trust
Bought by
Akker Edwin M Vanden M and Akker Edwin M
Purchase Details
Closed on
Apr 4, 1996
Sold by
Vanden Akker Edwin
Bought by
Vanden Akker Trust
Create a Home Valuation Report for This Property
The Home Valuation Report is an in-depth analysis detailing your home's value as well as a comparison with similar homes in the area
Home Values in the Area
Average Home Value in this Area
Purchase History
| Date | Buyer | Sale Price | Title Company |
|---|---|---|---|
| Vandenakker Revocable Trust | -- | None Listed On Document | |
| Vanden Akker Edwin M | -- | None Available | |
| Vanden Akker Edwin M | -- | None Available | |
| Akker Edwin M Vanden M | -- | None Available | |
| Vanden Akker Trust | -- | -- |
Source: Public Records
Tax History Compared to Growth
Tax History
| Year | Tax Paid | Tax Assessment Tax Assessment Total Assessment is a certain percentage of the fair market value that is determined by local assessors to be the total taxable value of land and additions on the property. | Land | Improvement |
|---|---|---|---|---|
| 2025 | $6,233 | $220,900 | $92,700 | $128,200 |
| 2024 | $5,707 | $207,500 | $84,300 | $123,200 |
| 2023 | $5,707 | $175,100 | $72,500 | $102,600 |
| 2022 | $5,707 | $146,000 | $63,800 | $82,200 |
| 2021 | $5,172 | $134,100 | $57,700 | $76,400 |
| 2020 | $5,172 | $129,000 | $54,800 | $74,200 |
| 2019 | $0 | $124,100 | $51,800 | $72,300 |
| 2018 | $0 | $134,600 | $63,200 | $71,400 |
| 2017 | $0 | $134,000 | $62,000 | $72,000 |
| 2016 | $0 | $139,400 | $66,800 | $72,600 |
| 2015 | -- | $139,400 | $66,800 | $72,600 |
| 2014 | -- | $132,800 | $65,300 | $67,500 |
| 2013 | -- | $117,400 | $57,200 | $60,200 |
Source: Public Records
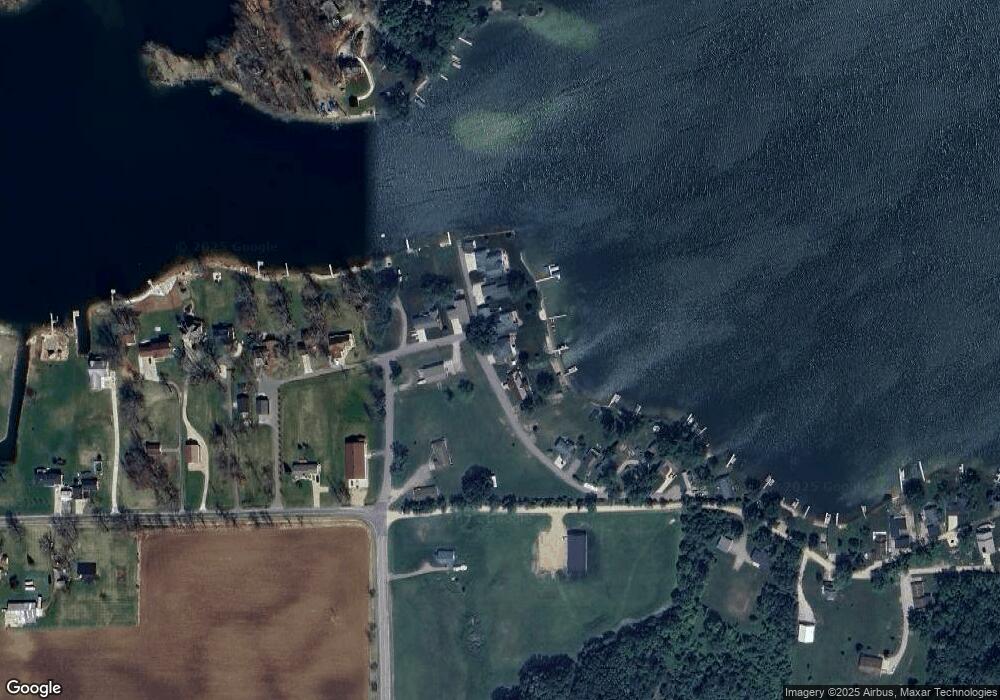
Map
Nearby Homes