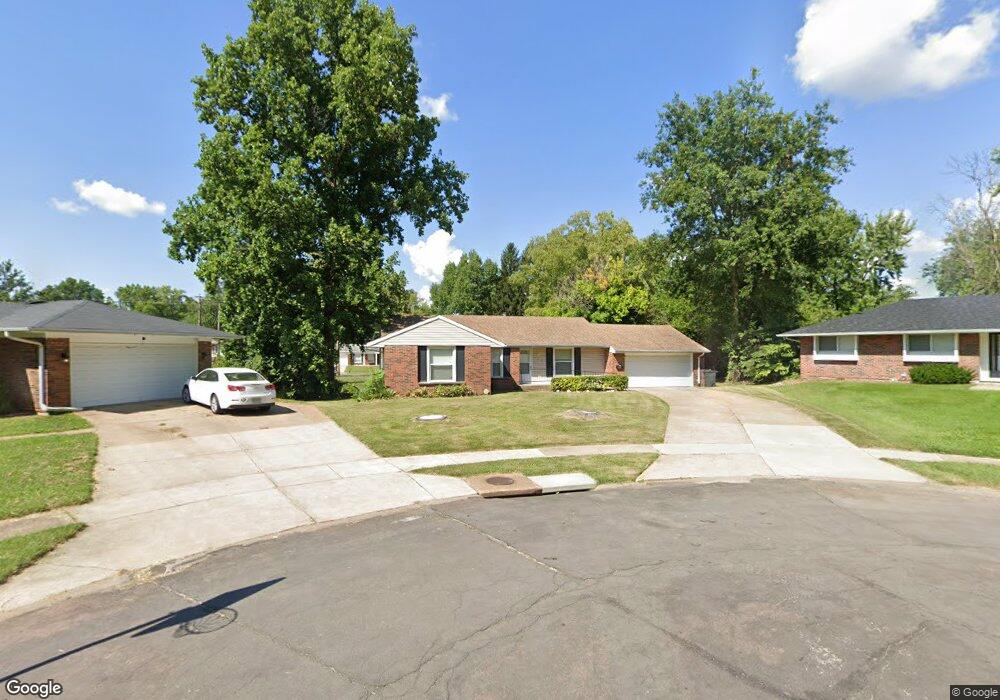
2583 Pontchartrain Dr Florissant, MO 63033
Estimated Value: $194,125 - $241,000
4
Beds
1
Bath
1,276
Sq Ft
$174/Sq Ft
Est. Value
About This Home
This home is located at 2583 Pontchartrain Dr, Florissant, MO 63033 and is currently estimated at $221,781, approximately $173 per square foot. 2583 Pontchartrain Dr is a home located in St. Louis County with nearby schools including Commons Lane Elementary School, Cross Keys Middle School, and McCluer North High School.
Ownership History
Date
Name
Owned For
Owner Type
Purchase Details
Closed on
Dec 22, 2017
Sold by
Kelley Carla
Bought by
Kelley Carla
Current Estimated Value
Home Financials for this Owner
Home Financials are based on the most recent Mortgage that was taken out on this home.
Original Mortgage
$127,612
Outstanding Balance
$90,432
Interest Rate
4.25%
Mortgage Type
FHA
Estimated Equity
$131,349
Purchase Details
Closed on
Mar 25, 2016
Sold by
Kelley Rufus
Bought by
Kelley Carla
Purchase Details
Closed on
Jan 18, 2008
Sold by
Gentberg Llc
Bought by
Kelley Rufus D and Kelley Carla R
Home Financials for this Owner
Home Financials are based on the most recent Mortgage that was taken out on this home.
Original Mortgage
$150,636
Interest Rate
6.11%
Mortgage Type
FHA
Purchase Details
Closed on
Sep 6, 2005
Sold by
Armstrong Robert N and Armstrong Carol L
Bought by
Gentberg Llc
Purchase Details
Closed on
Jan 21, 2005
Sold by
Gentry Michael D
Bought by
Gentry Leslie
Purchase Details
Closed on
Jun 13, 1997
Sold by
Ejr Hance William
Bought by
Usa Mtg Inc
Home Financials for this Owner
Home Financials are based on the most recent Mortgage that was taken out on this home.
Original Mortgage
$63,200
Interest Rate
7.93%
Create a Home Valuation Report for This Property
The Home Valuation Report is an in-depth analysis detailing your home's value as well as a comparison with similar homes in the area
Home Values in the Area
Average Home Value in this Area
Purchase History
| Date | Buyer | Sale Price | Title Company |
|---|---|---|---|
| Kelley Carla | -- | Servicelink East | |
| Kelley Carla | -- | None Available | |
| Kelley Rufus D | $153,000 | None Available | |
| Gentberg Llc | $20,000 | Clt | |
| Gentry Leslie | -- | -- | |
| Usa Mtg Inc | -- | -- |
Source: Public Records
Mortgage History
| Date | Status | Borrower | Loan Amount |
|---|---|---|---|
| Open | Kelley Carla | $127,612 | |
| Closed | Kelley Rufus D | $150,636 | |
| Previous Owner | Usa Mtg Inc | $63,200 |
Source: Public Records
Tax History Compared to Growth
Tax History
| Year | Tax Paid | Tax Assessment Tax Assessment Total Assessment is a certain percentage of the fair market value that is determined by local assessors to be the total taxable value of land and additions on the property. | Land | Improvement |
|---|---|---|---|---|
| 2025 | $2,245 | $30,550 | $4,120 | $26,430 |
| 2024 | $2,245 | $28,990 | $3,170 | $25,820 |
| 2023 | $2,237 | $28,990 | $3,170 | $25,820 |
| 2022 | $1,892 | $21,490 | $4,750 | $16,740 |
| 2021 | $1,860 | $21,490 | $4,750 | $16,740 |
| 2020 | $1,775 | $19,300 | $4,750 | $14,550 |
| 2019 | $1,741 | $19,300 | $4,750 | $14,550 |
| 2018 | $1,579 | $15,620 | $1,690 | $13,930 |
| 2017 | $1,571 | $15,620 | $1,690 | $13,930 |
| 2016 | $1,793 | $17,420 | $2,450 | $14,970 |
| 2015 | $1,804 | $17,420 | $2,450 | $14,970 |
| 2014 | $1,836 | $18,320 | $3,860 | $14,460 |
Source: Public Records
Map
Nearby Homes
- 3515 Saint Catherine St
- 2520 Greenberry Dr
- 3435 Saint Catherine St
- 2320 Greenberry Dr
- 3475 Stonehaven Dr
- 990 Saddle Dr
- 1945 Pohlman Rd
- 2255 Wheatfield Dr
- 670 Hargrove Ln
- 3270 Kingsley Dr
- 3140 Saint Catherine St
- 100 Broadmere Dr
- 3940 Parker Rd
- 4040 Helmkampf Dr
- 3150 Parker Rd
- 11849 Northport Dr
- 3190 N Waterford Dr
- 12415 Danube Dr
- 3905 Max-Weich Place
- 1540 Ascot Terrace
- 3648 Saint Catherine St
- 2584 Pontchartrain Dr
- 2563 Pontchartrain Dr
- 3652 Saint Catherine St
- 2543 Pontchartrain Dr
- 2565 Derhake Rd
- 2545 Derhake Rd
- 2544 Pontchartrain Dr
- 3690 Saint Catherine St
- 2525 Derhake Rd
- 3655 St Catherine St
- 3655 Saint Catherine St
- 2523 Pontchartrain Dr
- 3675 Saint Catherine St
- 3691 Salazar Dr
- 600 Creststone Dr
- 3695 Saint Catherine St
- 2483 Pontchartrain Dr
- 2484 Pontchartrain Dr