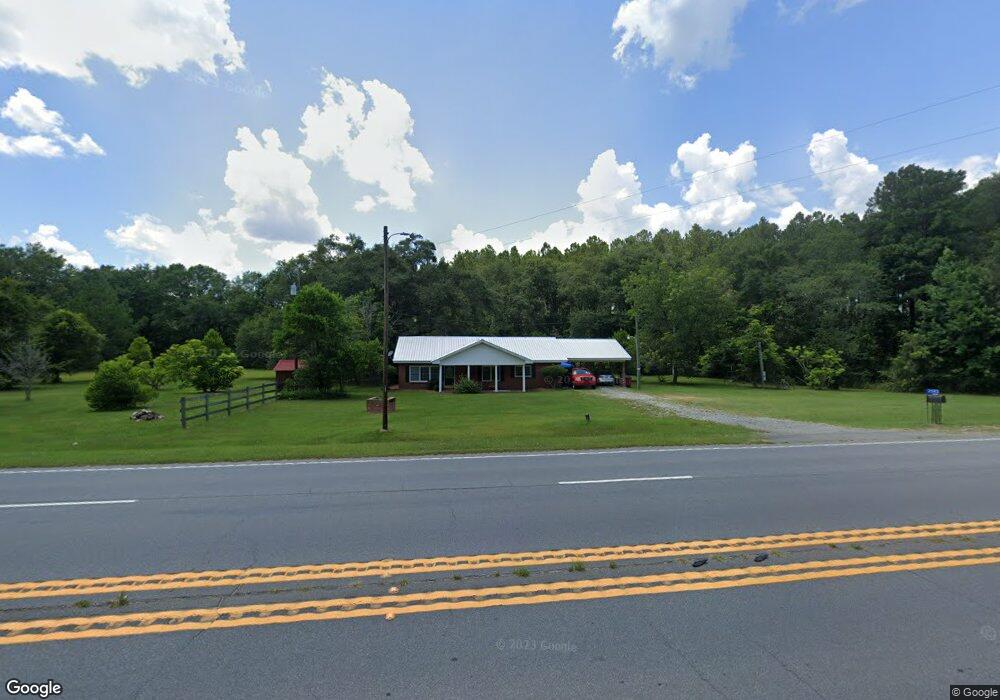
2583 Us Highway 441 S Dublin, GA 31021
Estimated Value: $133,000 - $294,000
--
Bed
2
Baths
2,219
Sq Ft
$91/Sq Ft
Est. Value
About This Home
This home is located at 2583 Us Highway 441 S, Dublin, GA 31021 and is currently estimated at $201,990, approximately $91 per square foot. 2583 Us Highway 441 S is a home located in Laurens County with nearby schools including Southwest Laurens Elementary School, Northwest Laurens Elementary School, and East Laurens Primary School.
Ownership History
Date
Name
Owned For
Owner Type
Purchase Details
Closed on
Jan 4, 2016
Sold by
Everett Jesse
Bought by
Everett Jimmy M and Everett Rhonda R
Current Estimated Value
Purchase Details
Closed on
Jan 2, 2015
Sold by
Sec Of Veterans Affa
Bought by
Everett Jesse
Purchase Details
Closed on
Sep 2, 2014
Sold by
Flagstar Bank Fsb
Bought by
Sec Of Veterans Affairs
Purchase Details
Closed on
May 28, 2010
Sold by
Federal Home Loan Mortgage Corporation
Bought by
Lyman Jamel and Lyman Cassandra
Home Financials for this Owner
Home Financials are based on the most recent Mortgage that was taken out on this home.
Original Mortgage
$99,000
Interest Rate
5%
Mortgage Type
VA
Purchase Details
Closed on
May 22, 2009
Sold by
Coleman John
Bought by
Exchange Bank
Purchase Details
Closed on
Jul 1, 2004
Sold by
Sapp Regina
Bought by
Coleman John W
Purchase Details
Closed on
Nov 30, 1986
Bought by
Sapp Regina
Create a Home Valuation Report for This Property
The Home Valuation Report is an in-depth analysis detailing your home's value as well as a comparison with similar homes in the area
Home Values in the Area
Average Home Value in this Area
Purchase History
| Date | Buyer | Sale Price | Title Company |
|---|---|---|---|
| Everett Jimmy M | -- | -- | |
| Everett Jesse | $45,000 | -- | |
| Sec Of Veterans Affairs | $71,442 | -- | |
| Flagstar Bank Fsb | -- | -- | |
| Lyman Jamel | $99,000 | -- | |
| Exchange Bank | -- | -- | |
| Federal Home Loan Mortgage Corporation | -- | -- | |
| Coleman John W | $140,000 | -- | |
| Sapp Regina | -- | -- |
Source: Public Records
Mortgage History
| Date | Status | Borrower | Loan Amount |
|---|---|---|---|
| Previous Owner | Lyman Jamel | $99,000 |
Source: Public Records
Tax History Compared to Growth
Tax History
| Year | Tax Paid | Tax Assessment Tax Assessment Total Assessment is a certain percentage of the fair market value that is determined by local assessors to be the total taxable value of land and additions on the property. | Land | Improvement |
|---|---|---|---|---|
| 2024 | $1,119 | $53,144 | $16,010 | $37,134 |
| 2023 | $1,073 | $50,522 | $16,010 | $34,512 |
| 2022 | $1,113 | $50,056 | $15,544 | $34,512 |
| 2021 | $1,113 | $48,770 | $13,650 | $35,120 |
| 2020 | $1,115 | $48,770 | $13,650 | $35,120 |
| 2019 | $1,115 | $48,770 | $13,650 | $35,120 |
| 2018 | $1,117 | $48,770 | $13,650 | $35,120 |
| 2017 | $1,116 | $48,770 | $13,650 | $35,120 |
| 2016 | $1,117 | $48,770 | $13,650 | $35,120 |
| 2015 | $1,117 | $48,770 | $13,650 | $35,120 |
| 2014 | $1,338 | $57,448 | $18,436 | $39,012 |
Source: Public Records
Map
Nearby Homes
- 0 S Highway 441
- 0 Wild Turkey Ridge Unit LOT 27 10373745
- 0 Hwy 441 Unit 29125
- 0 Hwy 441 Unit 29126
- 0 Apalachicola Trail Unit 25927
- 0 Apalachicola Trail Unit 25926
- 0 Chieftain Trail Unit 25908
- 0 Chieftain Trail Unit 25907
- 0 Chieftain Trail Unit LOT 104 20128136
- 0 Chieftain Trail Unit LOT 103 20128134
- 0 Apalachicola Trail Unit LOT 41 20128115
- 0 Apalachicola Trail Unit LOT 40 20128113
- 00 Payne Rd
- 1396 Grant Rowe Road B
- 00 Clyde Place
- 438 Lollie Dr
- 0 Clyde Place Unit 10529703
- 1293 Payne Rd
- 0 I-16 at Pinehill Rd Unit 27845
- 1004 Robertson Church Rd
- 1045 Dominy Camphouse Rd
- 1092 Dominy Camphouse Rd
- 2518 Us Highway 441
- 1015 Dominy Camphouse Rd
- 2501 Us-441 S
- 1007 Campground Rd
- 2666 Us Highway 441 S
- 2495 Us Highway 441 S
- 2496 Us Highway 441
- 2492 Us Highway 441 S
- 2489 Us Highway 441 S
- 2489 Us Highway 441
- 2484 Us Highway 441
- 2681 Us Highway 441 St
- 1112 Dominy Camphouse Rd
- 2457 Us Highway 441 S
- 2471 Us Highway 441
- 2463 Us Highway 441 S
- 2463 Us Highway 441