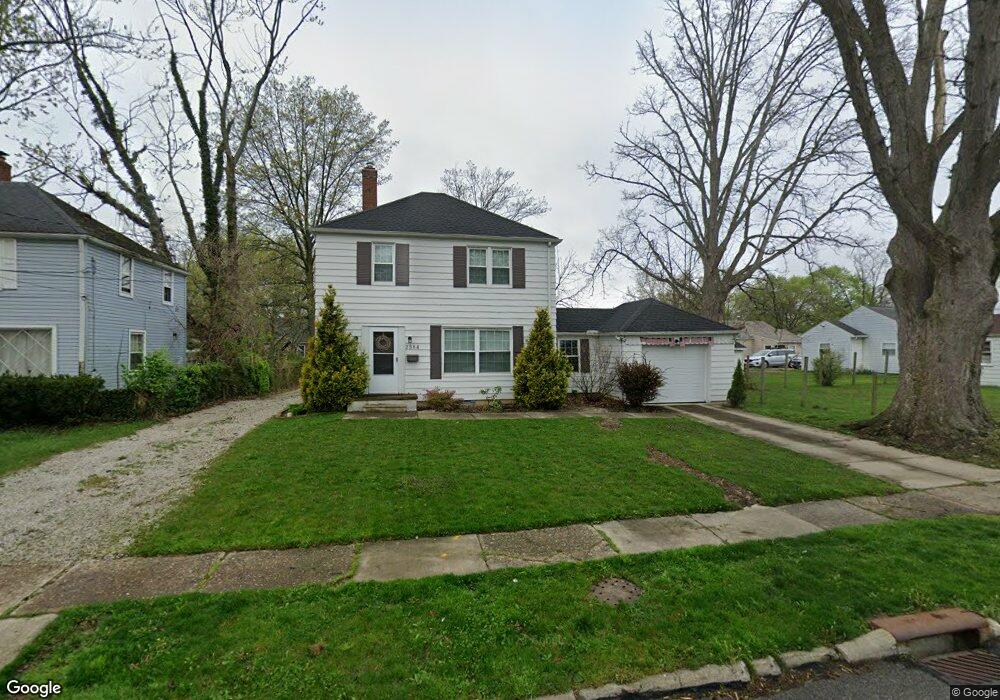
2584 8th St Cuyahoga Falls, OH 44221
Mud Brook NeighborhoodEstimated Value: $190,083 - $239,000
3
Beds
1
Bath
1,100
Sq Ft
$190/Sq Ft
Est. Value
About This Home
This home is located at 2584 8th St, Cuyahoga Falls, OH 44221 and is currently estimated at $208,521, approximately $189 per square foot. 2584 8th St is a home located in Summit County with nearby schools including Dewitt Elementary School, Bolich Middle School, and Cuyahoga Falls High School.
Ownership History
Date
Name
Owned For
Owner Type
Purchase Details
Closed on
Oct 28, 2016
Sold by
William J Ross
Bought by
Berry Stephanie
Current Estimated Value
Home Financials for this Owner
Home Financials are based on the most recent Mortgage that was taken out on this home.
Original Mortgage
$131,572
Outstanding Balance
$105,796
Interest Rate
3.47%
Estimated Equity
$102,725
Purchase Details
Closed on
Jan 25, 2016
Sold by
Walkley Benjamin T
Bought by
Quality Property Investments Llc
Purchase Details
Closed on
Nov 16, 2015
Sold by
Jaa Real Estate Llc
Bought by
Walkley Benjamin T
Create a Home Valuation Report for This Property
The Home Valuation Report is an in-depth analysis detailing your home's value as well as a comparison with similar homes in the area
Home Values in the Area
Average Home Value in this Area
Purchase History
| Date | Buyer | Sale Price | Title Company |
|---|---|---|---|
| Berry Stephanie | -- | -- | |
| Quality Property Investments Llc | $40,188 | Fireland Title | |
| Walkley Benjamin T | $17,000 | Fireland Titile |
Source: Public Records
Mortgage History
| Date | Status | Borrower | Loan Amount |
|---|---|---|---|
| Open | Berry Stephanie | $131,572 | |
| Closed | Berry Stephanie | -- |
Source: Public Records
Tax History Compared to Growth
Tax History
| Year | Tax Paid | Tax Assessment Tax Assessment Total Assessment is a certain percentage of the fair market value that is determined by local assessors to be the total taxable value of land and additions on the property. | Land | Improvement |
|---|---|---|---|---|
| 2025 | $2,887 | $53,421 | $11,417 | $42,004 |
| 2024 | $2,887 | $53,421 | $11,417 | $42,004 |
| 2023 | $2,887 | $53,421 | $11,417 | $42,004 |
| 2022 | $2,700 | $40,569 | $8,519 | $32,050 |
| 2021 | $2,700 | $40,569 | $8,519 | $32,050 |
| 2020 | $2,656 | $40,570 | $8,520 | $32,050 |
| 2019 | $2,800 | $38,950 | $8,520 | $30,430 |
| 2018 | $2,378 | $38,950 | $8,520 | $30,430 |
| 2017 | $2,160 | $38,950 | $8,520 | $30,430 |
| 2016 | $2,162 | $34,920 | $8,520 | $26,400 |
| 2015 | $2,160 | $34,920 | $8,520 | $26,400 |
| 2014 | $2,105 | $34,920 | $8,520 | $26,400 |
| 2013 | $2,248 | $37,600 | $8,520 | $29,080 |
Source: Public Records
Map
Nearby Homes