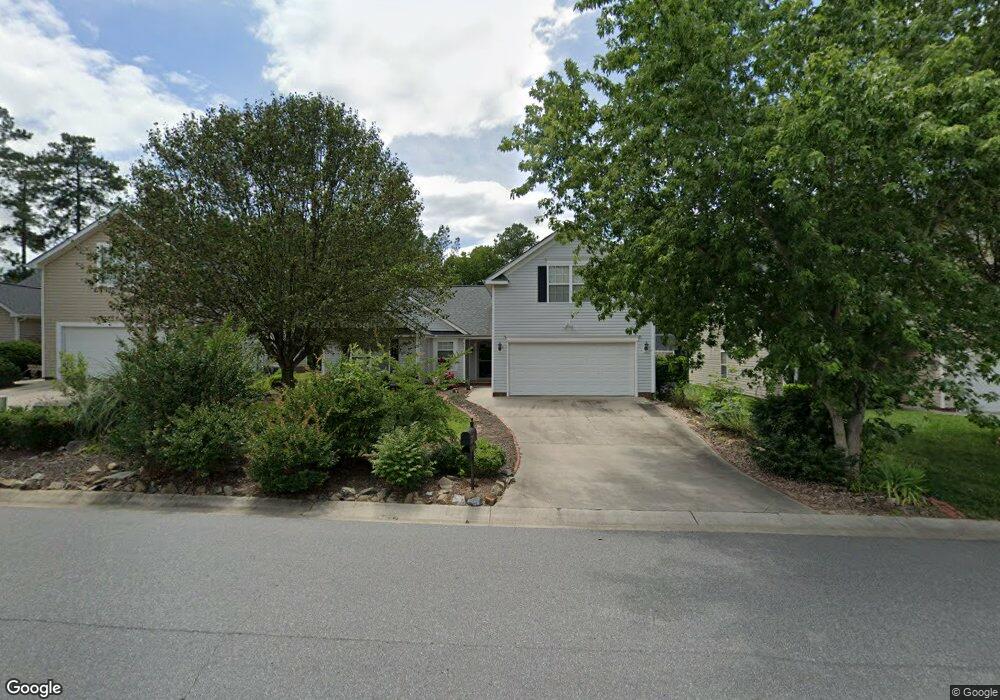
2584 Captains Watch Kannapolis, NC 28083
Estimated Value: $296,000 - $337,001
3
Beds
2
Baths
1,586
Sq Ft
$203/Sq Ft
Est. Value
About This Home
This home is located at 2584 Captains Watch, Kannapolis, NC 28083 and is currently estimated at $321,250, approximately $202 per square foot. 2584 Captains Watch is a home located in Cabarrus County with nearby schools including Forest Park Elementary School, Kannapolis Middle, and A.L. Brown High School.
Ownership History
Date
Name
Owned For
Owner Type
Purchase Details
Closed on
Dec 14, 2017
Sold by
Terry Troy B and Terry Faye L
Bought by
Terry Troy B and Terry Faye L
Current Estimated Value
Purchase Details
Closed on
Nov 18, 2013
Sold by
Cleaver Louis Ron and Cleaver Kay
Bought by
Terry Troy B and Terry Faye L
Purchase Details
Closed on
Sep 18, 2006
Sold by
Gb Homebuilders Llc
Bought by
Cleaver Louis Ron and Cleaver Kay
Home Financials for this Owner
Home Financials are based on the most recent Mortgage that was taken out on this home.
Original Mortgage
$76,959
Interest Rate
6.58%
Mortgage Type
Purchase Money Mortgage
Purchase Details
Closed on
May 24, 2006
Sold by
Lake Concord Associates Llc
Bought by
Gb Homebuilders Llc
Home Financials for this Owner
Home Financials are based on the most recent Mortgage that was taken out on this home.
Original Mortgage
$391,931
Interest Rate
6.41%
Mortgage Type
Construction
Create a Home Valuation Report for This Property
The Home Valuation Report is an in-depth analysis detailing your home's value as well as a comparison with similar homes in the area
Home Values in the Area
Average Home Value in this Area
Purchase History
| Date | Buyer | Sale Price | Title Company |
|---|---|---|---|
| Terry Troy B | -- | None Available | |
| Terry Troy B | $137,000 | None Available | |
| Cleaver Louis Ron | $157,500 | None Available | |
| Gb Homebuilders Llc | $38,500 | None Available |
Source: Public Records
Mortgage History
| Date | Status | Borrower | Loan Amount |
|---|---|---|---|
| Previous Owner | Cleaver Louis Ron | $76,959 | |
| Previous Owner | Gb Homebuilders Llc | $391,931 |
Source: Public Records
Tax History Compared to Growth
Tax History
| Year | Tax Paid | Tax Assessment Tax Assessment Total Assessment is a certain percentage of the fair market value that is determined by local assessors to be the total taxable value of land and additions on the property. | Land | Improvement |
|---|---|---|---|---|
| 2025 | $3,135 | $314,780 | $59,000 | $255,780 |
| 2024 | $3,135 | $314,780 | $59,000 | $255,780 |
| 2023 | $2,163 | $177,310 | $35,000 | $142,310 |
| 2022 | $2,163 | $177,310 | $35,000 | $142,310 |
| 2021 | $2,163 | $177,310 | $35,000 | $142,310 |
| 2020 | $2,163 | $177,310 | $35,000 | $142,310 |
| 2019 | $1,536 | $125,940 | $19,000 | $106,940 |
| 2018 | $1,511 | $125,940 | $19,000 | $106,940 |
| 2017 | $1,486 | $125,940 | $19,000 | $106,940 |
| 2016 | $882 | $141,340 | $29,000 | $112,340 |
| 2015 | $1,668 | $141,340 | $29,000 | $112,340 |
| 2014 | $1,668 | $141,340 | $29,000 | $112,340 |
Source: Public Records
Map
Nearby Homes
- 915 Harbour View Cove NE
- 839 Anchor Way NE
- 4750 J W Cline Rd
- 2495 Centergrove Rd
- 925 Anchor Way NE
- 2405 Forrestbrook Dr
- 2245 Heritage Ct Unit 2
- 2416 Forrestbrook Dr
- 2458 Saguaro Ln
- 2485 Acadia Ct
- 2882 Centergrove Rd
- 00 Dixie Dr
- 252 Forest Pond Rd
- 2990 Dale Earnhardt Blvd
- 512 Villa St
- 1699 Mission Oaks St
- 14 Knowles St
- 2412 Brantley Rd
- 3007 Centergrove Rd
- 108 S Little Texas Rd
- 2580 Captains Watch
- 2588 Captains Watch
- 2576 Captains Watch
- 2592 Captains Watch
- 2572 Captains Watch
- 2583 Captains Watch Rd NE
- 2587 Captains Watch
- 2583 Captains Watch
- 2596 Captains Watch
- 2593 Captains Watch
- 2571 Captains Watch
- 2568 Captains Watch
- 2597 Captains Watch
- 2600 Captains Watch
- 2608 Misty Cove
- 2608 Misty Cove Place NE
- 808 Anchor Way NE
- 2564 Captains Watch
- 2563 Captains Watch
- 2612 Misty Cove