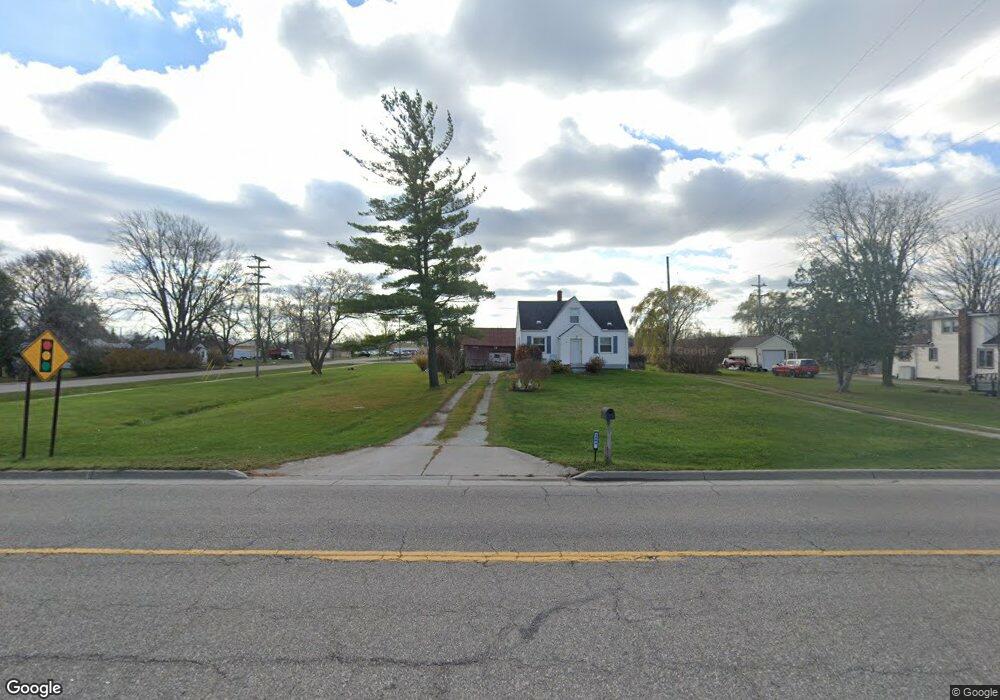
2584 Howard St Port Huron, MI 48060
Estimated Value: $159,000 - $189,000
4
Beds
1
Bath
1,400
Sq Ft
$127/Sq Ft
Est. Value
About This Home
This home is located at 2584 Howard St, Port Huron, MI 48060 and is currently estimated at $178,124, approximately $127 per square foot. 2584 Howard St is a home located in St. Clair County with nearby schools including Michigamme Elementary School, Central Middle School, and Port Huron High School.
Ownership History
Date
Name
Owned For
Owner Type
Purchase Details
Closed on
Sep 23, 2021
Sold by
Oconnor Denise
Bought by
Gurnsey Kayley D and Buchko John
Current Estimated Value
Purchase Details
Closed on
Mar 21, 2019
Sold by
Denise Oconnor
Bought by
Oconnor Denise
Purchase Details
Closed on
Sep 12, 2013
Sold by
Connor Denise O
Bought by
Connor Gail O
Purchase Details
Closed on
Jun 20, 2007
Sold by
Oconnor Gail and Scott Winona M
Bought by
Oconnor Gail and Oconnor Denise
Create a Home Valuation Report for This Property
The Home Valuation Report is an in-depth analysis detailing your home's value as well as a comparison with similar homes in the area
Home Values in the Area
Average Home Value in this Area
Purchase History
| Date | Buyer | Sale Price | Title Company |
|---|---|---|---|
| Gurnsey Kayley D | $154,050 | Ata National Title Group Llc | |
| Oconnor Denise | -- | None Listed On Document | |
| Connor Gail O | -- | None Available | |
| Oconnor Gail | -- | None Available |
Source: Public Records
Tax History Compared to Growth
Tax History
| Year | Tax Paid | Tax Assessment Tax Assessment Total Assessment is a certain percentage of the fair market value that is determined by local assessors to be the total taxable value of land and additions on the property. | Land | Improvement |
|---|---|---|---|---|
| 2025 | $1,775 | $73,900 | $0 | $0 |
| 2024 | $934 | $73,500 | $0 | $0 |
| 2023 | $862 | $56,100 | $0 | $0 |
| 2022 | $1,592 | $45,700 | $0 | $0 |
| 2021 | $980 | $41,200 | $0 | $0 |
| 2020 | $980 | $41,500 | $41,500 | $0 |
| 2019 | $962 | $31,700 | $0 | $0 |
| 2018 | $939 | $31,700 | $0 | $0 |
| 2017 | $918 | $31,200 | $0 | $0 |
| 2016 | $476 | $31,200 | $0 | $0 |
| 2015 | -- | $31,300 | $31,300 | $0 |
| 2014 | -- | $30,100 | $30,100 | $0 |
| 2013 | -- | $30,000 | $0 | $0 |
Source: Public Records
Map
Nearby Homes