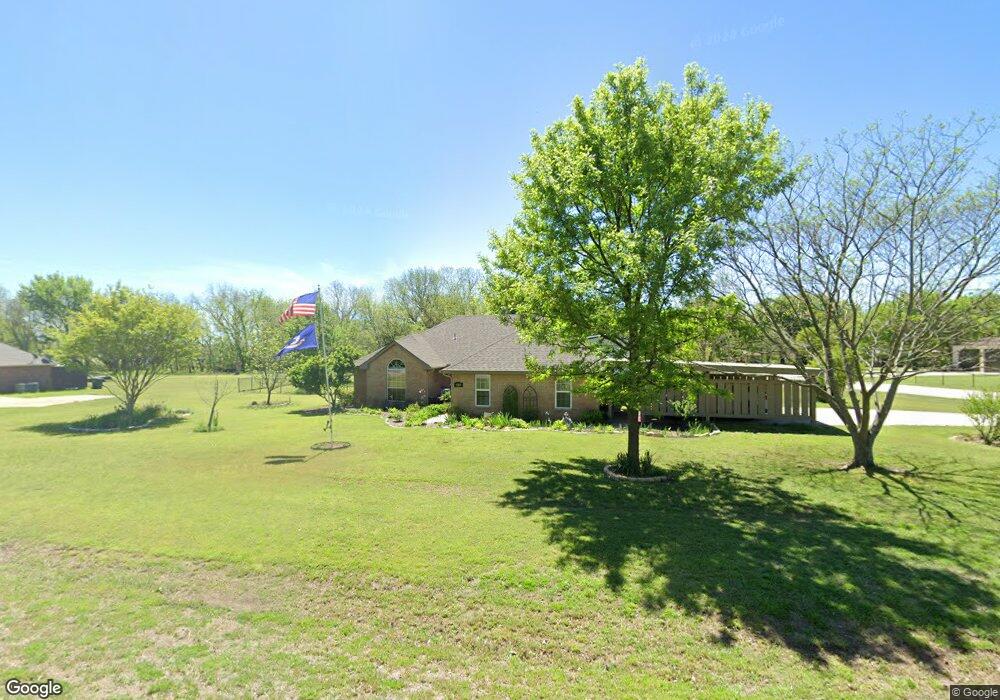
2585 Old Mineral Wells Hwy Weatherford, TX 76088
Estimated Value: $425,756 - $488,000
--
Bed
--
Bath
2,231
Sq Ft
$205/Sq Ft
Est. Value
About This Home
This home is located at 2585 Old Mineral Wells Hwy, Weatherford, TX 76088 and is currently estimated at $456,939, approximately $204 per square foot. 2585 Old Mineral Wells Hwy is a home located in Parker County with nearby schools including Millsap Elementary School, Millsap Middle School, and Millsap High School.
Ownership History
Date
Name
Owned For
Owner Type
Purchase Details
Closed on
Dec 18, 2024
Sold by
Connor Roger L and Connor Blanche Ann
Bought by
Connor Family Trust and Connor
Current Estimated Value
Purchase Details
Closed on
Jul 5, 2006
Sold by
Bob Fink Homes Inc
Bought by
Connor Roger and Connor Ann
Home Financials for this Owner
Home Financials are based on the most recent Mortgage that was taken out on this home.
Original Mortgage
$29,950
Interest Rate
6.6%
Mortgage Type
Purchase Money Mortgage
Purchase Details
Closed on
Jun 10, 2005
Sold by
Wcw Limited Partnership
Bought by
Connor Roger and Connor Ann
Home Financials for this Owner
Home Financials are based on the most recent Mortgage that was taken out on this home.
Original Mortgage
$18,900
Interest Rate
5.76%
Mortgage Type
Future Advance Clause Open End Mortgage
Create a Home Valuation Report for This Property
The Home Valuation Report is an in-depth analysis detailing your home's value as well as a comparison with similar homes in the area
Home Values in the Area
Average Home Value in this Area
Purchase History
| Date | Buyer | Sale Price | Title Company |
|---|---|---|---|
| Connor Family Trust | -- | None Listed On Document | |
| Connor Roger | -- | Stnt | |
| Connor Roger | -- | -- | |
| Bob Fink Homes Inc | -- | None Available |
Source: Public Records
Mortgage History
| Date | Status | Borrower | Loan Amount |
|---|---|---|---|
| Previous Owner | Connor Roger | $29,950 | |
| Previous Owner | Connor Roger | $119,900 | |
| Previous Owner | Connor Roger | $18,900 |
Source: Public Records
Tax History Compared to Growth
Tax History
| Year | Tax Paid | Tax Assessment Tax Assessment Total Assessment is a certain percentage of the fair market value that is determined by local assessors to be the total taxable value of land and additions on the property. | Land | Improvement |
|---|---|---|---|---|
| 2025 | $2,910 | $396,140 | $87,420 | $308,720 |
| 2024 | $2,910 | $355,157 | -- | -- |
| 2023 | $2,910 | $322,870 | $0 | $0 |
| 2022 | $5,569 | $293,520 | $35,000 | $258,520 |
| 2021 | $5,644 | $293,520 | $35,000 | $258,520 |
| 2020 | $5,305 | $246,580 | $25,000 | $221,580 |
| 2019 | $5,689 | $246,580 | $25,000 | $221,580 |
| 2018 | $5,272 | $225,980 | $20,000 | $205,980 |
| 2017 | $4,462 | $184,697 | $20,000 | $164,697 |
| 2016 | $3,880 | $160,630 | $20,000 | $140,630 |
| 2015 | $2,760 | $159,630 | $20,000 | $139,630 |
| 2014 | $2,880 | $148,380 | $20,000 | $128,380 |
Source: Public Records
Map
Nearby Homes
- 2435 Old Mineral Wells Hwy
- 167 Duke Trail
- 1008 Salvation Dr
- 109 Rio Bravo Ct
- 100 Rio Bravo Ct
- 4025 Life Dr
- 4024 Life Dr
- 1061 Salvation Dr
- 2097 Redemption Dr
- 2068 Redemption Dr
- 3024 Truth Ct
- TBD Old Mineral Wells Hwy
- 1033 Salvation Dr
- 1009 Salvation Dr
- 1057 Salvation Dr
- 1017 Salvation Dr
- 103 Saddle Club Rd
- Brazos Plan at Freeman Ranch
- Longhorn Plan at Freeman Ranch
- Colorado Plan at Freeman Ranch
- 2563 Old Mineral Wells Hwy
- 105 Endive
- 104 Endive
- 2541 Old Mineral Wells Hwy
- 108 Endive
- 2651 Old Mineral Wells Hwy
- 100 Cinnamon Ct
- 101 Butternut Ct
- 104 Cinnamon Ct
- 101 Cinnamon Ct
- 2525 Old Mineral Wells Hwy
- 105 Butternut Ct
- 1012 Bobcat Pass Dr
- 100 Butternut Ct
- 109 Butternut Ct
- 104 Butternut Ct
- 108 Cinnamon Ct
- 107 Cinnamon Ct
- 105 Oakwood Creek Ln
- 101 Oakwood Creek Ln