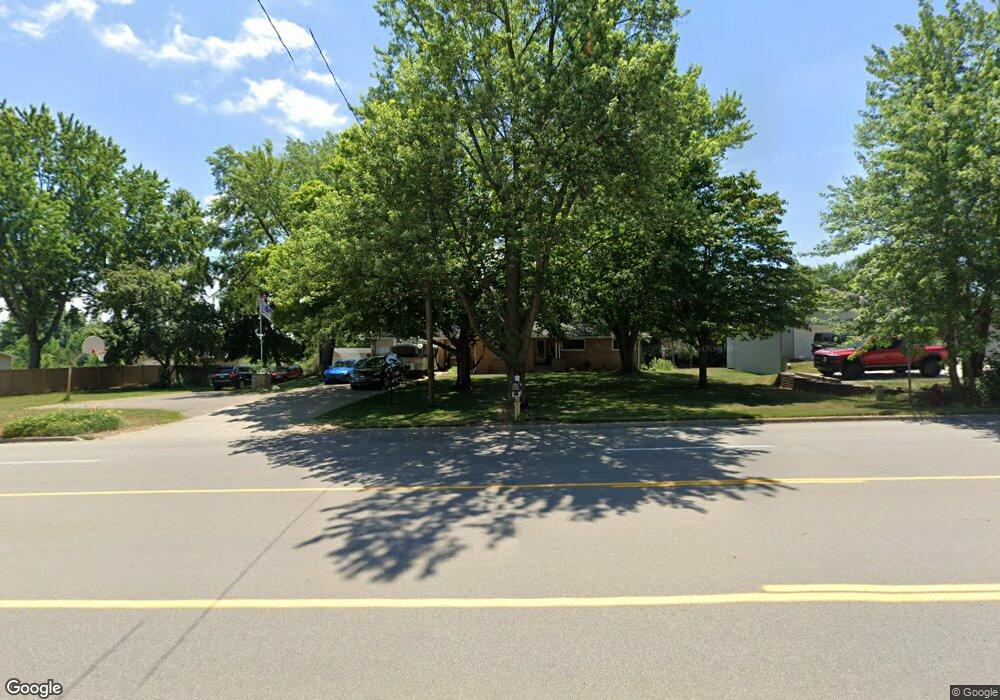
2586 60th St SE Grand Rapids, MI 49508
Estimated Value: $352,000 - $381,000
4
Beds
2
Baths
2,700
Sq Ft
$134/Sq Ft
Est. Value
About This Home
This home is located at 2586 60th St SE, Grand Rapids, MI 49508 and is currently estimated at $362,251, approximately $134 per square foot. 2586 60th St SE is a home located in Kent County with nearby schools including Discovery Elementary School, Pinewood Middle School, and East Kentwood Freshman Campus.
Ownership History
Date
Name
Owned For
Owner Type
Purchase Details
Closed on
Mar 13, 2007
Sold by
Federal National Mortgage Association
Bought by
Edwards Jeffrey M
Current Estimated Value
Home Financials for this Owner
Home Financials are based on the most recent Mortgage that was taken out on this home.
Original Mortgage
$113,520
Outstanding Balance
$69,610
Interest Rate
6.5%
Mortgage Type
Purchase Money Mortgage
Estimated Equity
$292,641
Purchase Details
Closed on
Dec 7, 2005
Sold by
Mortgage Electronic Registration Systems
Bought by
Federal National Mortgage Association
Purchase Details
Closed on
Nov 2, 2005
Sold by
Betts Rodney and Betts Wendy
Bought by
Mortgage Electronic Registration Systems and Homecomings Financial Network Inc
Purchase Details
Closed on
May 26, 1999
Sold by
Byma Gary J
Bought by
Betts Rodney and Edwards Jeffrey M
Purchase Details
Closed on
May 7, 1992
Bought by
Byma Gary J and Edwards Jeffrey M
Create a Home Valuation Report for This Property
The Home Valuation Report is an in-depth analysis detailing your home's value as well as a comparison with similar homes in the area
Home Values in the Area
Average Home Value in this Area
Purchase History
| Date | Buyer | Sale Price | Title Company |
|---|---|---|---|
| Edwards Jeffrey M | -- | None Available | |
| Federal National Mortgage Association | -- | Parks Title | |
| Mortgage Electronic Registration Systems | $149,489 | -- | |
| Betts Rodney | $152,000 | -- | |
| Byma Gary J | $85,900 | -- |
Source: Public Records
Mortgage History
| Date | Status | Borrower | Loan Amount |
|---|---|---|---|
| Open | Edwards Jeffrey M | $113,520 |
Source: Public Records
Tax History Compared to Growth
Tax History
| Year | Tax Paid | Tax Assessment Tax Assessment Total Assessment is a certain percentage of the fair market value that is determined by local assessors to be the total taxable value of land and additions on the property. | Land | Improvement |
|---|---|---|---|---|
| 2025 | $1,802 | $186,900 | $0 | $0 |
| 2024 | $1,802 | $175,300 | $0 | $0 |
| 2023 | $1,642 | $130,000 | $0 | $0 |
| 2022 | $1,642 | $116,200 | $0 | $0 |
| 2021 | $2,210 | $112,500 | $0 | $0 |
| 2020 | $1,599 | $104,500 | $0 | $0 |
| 2019 | $2,073 | $91,600 | $0 | $0 |
| 2018 | $2,073 | $85,700 | $18,000 | $67,700 |
| 2017 | $0 | $73,700 | $0 | $0 |
| 2016 | $0 | $73,200 | $0 | $0 |
| 2015 | -- | $73,200 | $0 | $0 |
| 2013 | -- | $62,900 | $0 | $0 |
Source: Public Records
Map
Nearby Homes
- 2772 60th St SE
- Integrity 2000 Plan at Bretonfield Preserve
- Integrity 2280 Plan at Bretonfield Preserve
- Integrity 2085 Plan at Bretonfield Preserve
- Integrity 1910 Plan at Bretonfield Preserve
- Integrity 1530 Plan at Bretonfield Preserve
- Elements 2090 Plan at Bretonfield Preserve
- Elements 2070 Plan at Bretonfield Preserve
- Elements 2390 Plan at Bretonfield Preserve
- Integrity 2080 Plan at Bretonfield Preserve
- Integrity 1610 Plan at Bretonfield Preserve
- Elements 1680 Plan at Bretonfield Preserve
- Elements 1870 Plan at Bretonfield Preserve
- Elements 2200 Plan at Bretonfield Preserve
- Elements 2100 Plan at Bretonfield Preserve
- Elements 2700 Plan at Bretonfield Preserve
- Integrity 1880 Plan at Bretonfield Preserve
- 2683 Hawk Ridge Ct
- 5829 Birdsong Ct SE
- 2727 Blooming Bud SE
- 2580 60th St SE
- 2580 60th St SE Unit 2582
- 2626 60th St SE
- 2572 60th St SE
- 2572 60th St SE Unit 2574
- 2577 60th St SE
- 2642 60th St SE
- 2605 60th St SE
- 2550 60th St SE
- 2634 Sage Wing Dr SE
- 2640 Sage Wing Dr SE
- 2656 60th St SE
- 2648 Sage Wing Dr SE
- 2530 60th St SE
- 2656 Sage Wing Dr SE
- 5986 Sable Ridge Dr SE
- 2664 Sage Wing Dr SE
- 5978 Sable Ridge Dr SE
- 5970 Sable Ridge Dr SE Unit 3
- 2631 Sage Wing Dr SE