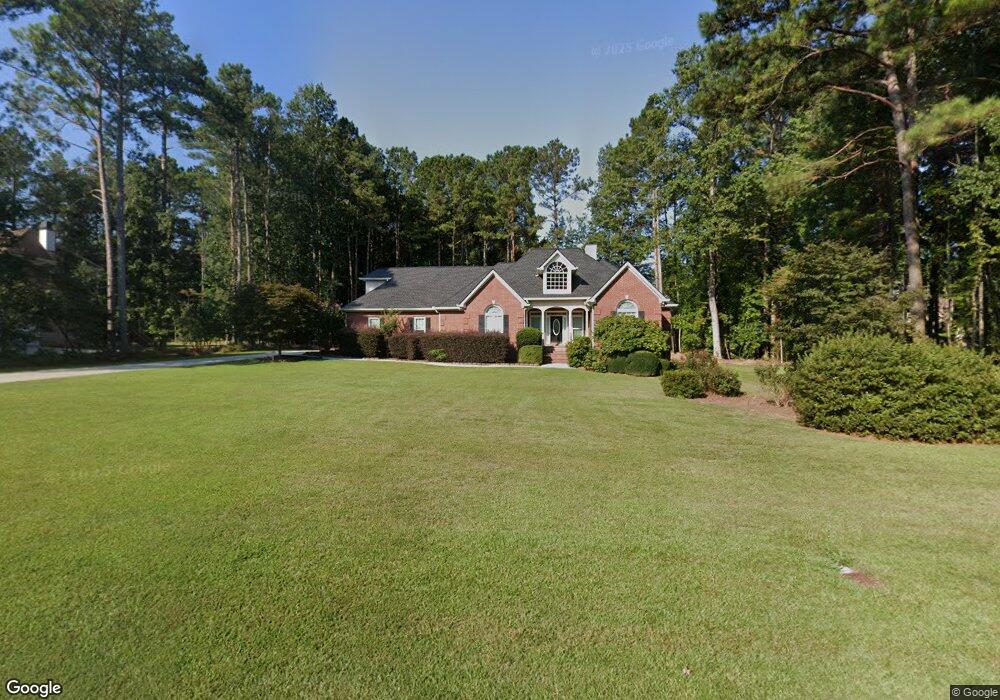
2586 Orchard Walk Jonesboro, GA 30236
Estimated Value: $429,580 - $651,000
4
Beds
3
Baths
3,655
Sq Ft
$147/Sq Ft
Est. Value
About This Home
This home is located at 2586 Orchard Walk, Jonesboro, GA 30236 and is currently estimated at $538,193, approximately $147 per square foot. 2586 Orchard Walk is a home located in Clayton County with nearby schools including Suder Elementary School, M. D. Roberts Middle School, and Jonesboro High School.
Ownership History
Date
Name
Owned For
Owner Type
Purchase Details
Closed on
Dec 28, 2009
Sold by
Lenders Other Instl
Bought by
Mathes Lee R and Mathes Martha B
Current Estimated Value
Home Financials for this Owner
Home Financials are based on the most recent Mortgage that was taken out on this home.
Original Mortgage
$168,800
Outstanding Balance
$110,094
Interest Rate
4.82%
Mortgage Type
New Conventional
Estimated Equity
$428,099
Purchase Details
Closed on
Aug 4, 2009
Sold by
Perkins William E
Bought by
Popular Abs Inc Series 2005-C
Purchase Details
Closed on
Dec 3, 2004
Sold by
Orchard Walk Trust
Bought by
Perkins William E
Home Financials for this Owner
Home Financials are based on the most recent Mortgage that was taken out on this home.
Original Mortgage
$232,000
Interest Rate
5.69%
Mortgage Type
New Conventional
Purchase Details
Closed on
Sep 20, 2003
Sold by
Bush Len A and Bush Deborah J
Bought by
Orchard Walk Land Trust
Purchase Details
Closed on
Jul 25, 1996
Sold by
Orchardestates Spivey
Bought by
Bush Len A Deborah J
Create a Home Valuation Report for This Property
The Home Valuation Report is an in-depth analysis detailing your home's value as well as a comparison with similar homes in the area
Home Values in the Area
Average Home Value in this Area
Purchase History
| Date | Buyer | Sale Price | Title Company |
|---|---|---|---|
| Mathes Lee R | $211,000 | -- | |
| Popular Abs Inc Series 2005-C | $176,400 | -- | |
| Perkins William E | $290,000 | -- | |
| Orchard Walk Land Trust | -- | -- | |
| Bush Len A Deborah J | $31,500 | -- |
Source: Public Records
Mortgage History
| Date | Status | Borrower | Loan Amount |
|---|---|---|---|
| Open | Mathes Lee R | $168,800 | |
| Previous Owner | Perkins William E | $232,000 |
Source: Public Records
Tax History Compared to Growth
Tax History
| Year | Tax Paid | Tax Assessment Tax Assessment Total Assessment is a certain percentage of the fair market value that is determined by local assessors to be the total taxable value of land and additions on the property. | Land | Improvement |
|---|---|---|---|---|
| 2024 | $3,350 | $184,000 | $12,880 | $171,120 |
| 2023 | $5,038 | $193,720 | $14,000 | $179,720 |
| 2022 | $2,466 | $139,520 | $14,000 | $125,520 |
| 2021 | $2,195 | $124,000 | $14,000 | $110,000 |
| 2020 | $4,609 | $124,000 | $14,000 | $110,000 |
| 2019 | $4,678 | $129,241 | $14,000 | $115,241 |
| 2018 | $3,281 | $89,600 | $14,000 | $75,600 |
| 2017 | $3,289 | $89,600 | $14,000 | $75,600 |
| 2016 | $3,094 | $99,785 | $14,000 | $85,785 |
| 2015 | $3,091 | $0 | $0 | $0 |
| 2014 | $3,074 | $86,000 | $14,000 | $72,000 |
Source: Public Records
Map
Nearby Homes
- 2508 Quentin Dr
- 2519 Quentin Dr
- 2506 Emerald Dr
- 2484 Emerald Dr
- 2544 Carnes Rd
- 2730 Emerald Dr
- 2444 Quentin Dr
- 2345 Lake Jodeco Rd
- 2330 Lago Dr
- 2316 Emerald Dr
- 0 Carnes Rd Unit 7665396
- 2328 Carnes Rd
- 2645 Creek Indian Trail
- 2270 Emerald Dr
- 2811 Carnes Rd
- 3003 Emerald Dr
- 2317 Forest Dr
- 2461 Creekside Trace
- 8566 Shoreline Dr Unit IV
- 2220 Emerald Dr
- 2568 Orchard Walk
- 2606 Orchard Walk Unit 3
- 2579 Spivey Ct
- 2580 Spivey Ct
- 2583 Orchard Walk Unit 3
- 2603 Orchard Walk Unit 3
- 2573 Spivey Ct
- 2563 Orchard Walk
- 2624 Orchard Walk
- 2574 Spivey Ct
- 2641 Orchard Walk Unit 3
- 2563 Spivey Ct
- 2611 Lake Jodeco Rd
- 2629 Lake Jodeco Rd
- 2562 Spivey Ct
- 2593 Lake Jodeco Rd
- 2551 Spivey Ct
- 2638 Orchard Walk
- 8945 Redskin Trail
- 8925 Redskin Trail