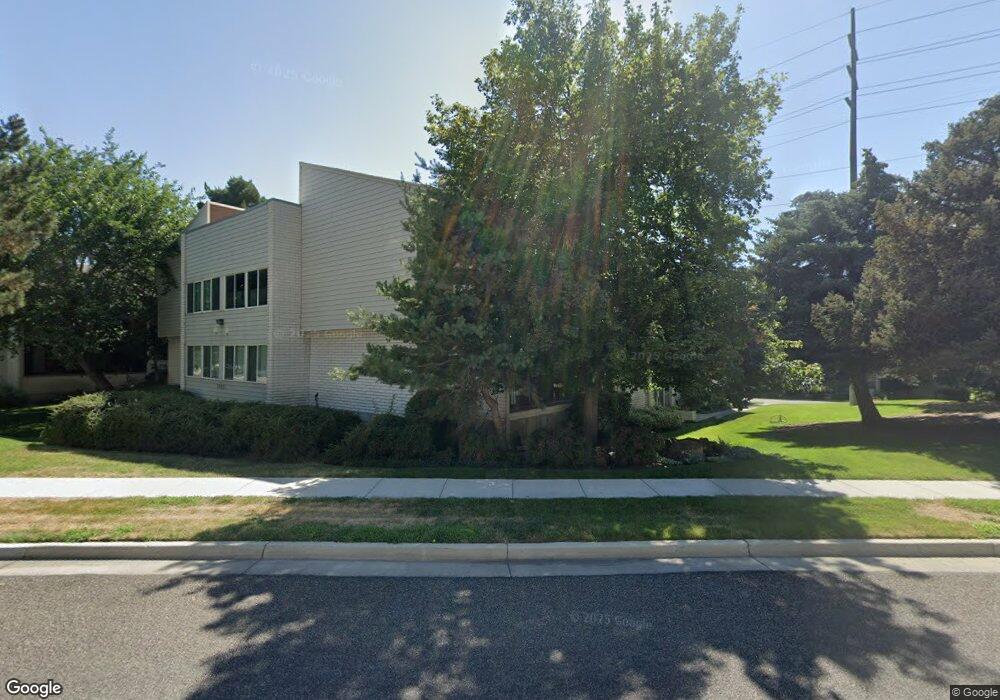
2586 S Elizabeth St Unit 2 Salt Lake City, UT 84106
Sugar House NeighborhoodEstimated Value: $509,000 - $570,496
2
Beds
2
Baths
1,748
Sq Ft
$316/Sq Ft
Est. Value
About This Home
This home is located at 2586 S Elizabeth St Unit 2, Salt Lake City, UT 84106 and is currently estimated at $551,874, approximately $315 per square foot. 2586 S Elizabeth St Unit 2 is a home located in Salt Lake County with nearby schools including Nibley Park School, Highland High School, and Carden Memorial School.
Ownership History
Date
Name
Owned For
Owner Type
Purchase Details
Closed on
Jan 5, 2024
Sold by
Jacqueline K Harover Living Trust
Bought by
Tiru Narayan Revocable Trust and Narayan
Current Estimated Value
Home Financials for this Owner
Home Financials are based on the most recent Mortgage that was taken out on this home.
Original Mortgage
$350,000
Outstanding Balance
$344,258
Interest Rate
7.29%
Mortgage Type
New Conventional
Estimated Equity
$207,616
Purchase Details
Closed on
May 2, 2016
Sold by
Harover Jacqueline K
Bought by
Harover Jacqueline K and The Jacqueline K Harover Living Trust
Purchase Details
Closed on
Apr 29, 2015
Sold by
Integrlty Funding 6 Llc
Bought by
Harover Jacqueline K
Purchase Details
Closed on
Nov 4, 2014
Sold by
Weenig Margaret Anne
Bought by
Integrity Funding 6 Llc
Purchase Details
Closed on
Nov 20, 2003
Sold by
Weenig Ronald Z and Weenig Margaret Anne
Bought by
Weenig Ronald Z and Weenig Margaret Anne
Create a Home Valuation Report for This Property
The Home Valuation Report is an in-depth analysis detailing your home's value as well as a comparison with similar homes in the area
Home Values in the Area
Average Home Value in this Area
Purchase History
| Date | Buyer | Sale Price | Title Company |
|---|---|---|---|
| Tiru Narayan Revocable Trust | -- | Cottonwood Title | |
| Harover Jacqueline K | -- | None Available | |
| Harover Jacqueline K | -- | Highland Title Agency | |
| Integrity Funding 6 Llc | -- | First American Title | |
| Weenig Ronald Z | -- | -- |
Source: Public Records
Mortgage History
| Date | Status | Borrower | Loan Amount |
|---|---|---|---|
| Open | Tiru Narayan Revocable Trust | $350,000 |
Source: Public Records
Tax History Compared to Growth
Tax History
| Year | Tax Paid | Tax Assessment Tax Assessment Total Assessment is a certain percentage of the fair market value that is determined by local assessors to be the total taxable value of land and additions on the property. | Land | Improvement |
|---|---|---|---|---|
| 2025 | -- | $521,800 | $156,500 | $365,300 |
| 2024 | -- | $512,400 | $153,700 | $358,700 |
| 2023 | $2,504 | $460,500 | $138,100 | $322,400 |
| 2022 | $3,078 | $531,100 | $159,300 | $371,800 |
| 2021 | $2,487 | $388,500 | $116,500 | $272,000 |
| 2020 | $2,441 | $363,000 | $108,900 | $254,100 |
| 2019 | $2,725 | $381,300 | $114,400 | $266,900 |
| 2018 | $2,402 | $327,300 | $98,200 | $229,100 |
| 2017 | $2,299 | $293,400 | $88,000 | $205,400 |
| 2016 | $2,475 | $350,000 | $105,000 | $245,000 |
| 2015 | $1,751 | $222,200 | $66,700 | $155,500 |
| 2014 | -- | $220,000 | $66,000 | $154,000 |
Source: Public Records
Map
Nearby Homes
- 2618 S 1100 E
- 2438 S Elizabeth St Unit 2
- 2430 S Elizabeth St Unit 5
- 1130 E 2700 S Unit K83
- 2400 S Elizabeth St Unit 4
- 1168 E Parkway Ave
- 1190 E 2700 S Unit A4
- 1190 E 2700 S Unit A1
- 1150 E 2700 S Unit G51
- 1150 E 2700 S Unit 50G
- 1192 E 2700 S
- 2710 S Highland Dr Unit 11
- 1214 E Parkway Ave
- 1152 E 2700 S Unit S148
- 2477 S Douglas St
- 2760 S Highland Dr Unit 21
- 2760 S Highland Dr Unit 20
- 916 E Forest View Ave
- 1978 S Windsor Cir
- 829 E 2700 S
- 2586 S Elizabeth St Unit 7
- 2586 S Elizabeth St Unit 6
- 2586 S Elizabeth St Unit 4
- 2586 S Elizabeth St Unit 1
- 2586 S Elizabeth St Unit 8
- 2586 S Elizabeth St Unit 3
- 2586 S Elizabeth St Unit 2
- 2586 S Elizabeth St Unit 5
- 2586 S Elizabeth St Unit 3
- 2586 S Elizabeth St Unit 4
- 2586 S Elizabeth St Unit 8
- 2580 S Elizabeth St Unit 6
- 2580 S Elizabeth St Unit 3
- 2580 S Elizabeth St Unit 4
- 2580 S Elizabeth St Unit 8
- 2580 S Elizabeth St Unit 1
- 2580 S Elizabeth St Unit 7
- 2580 S Elizabeth St Unit 5
- 2580 S Elizabeth St Unit 2
- 2580 S Elizabeth St Unit 6