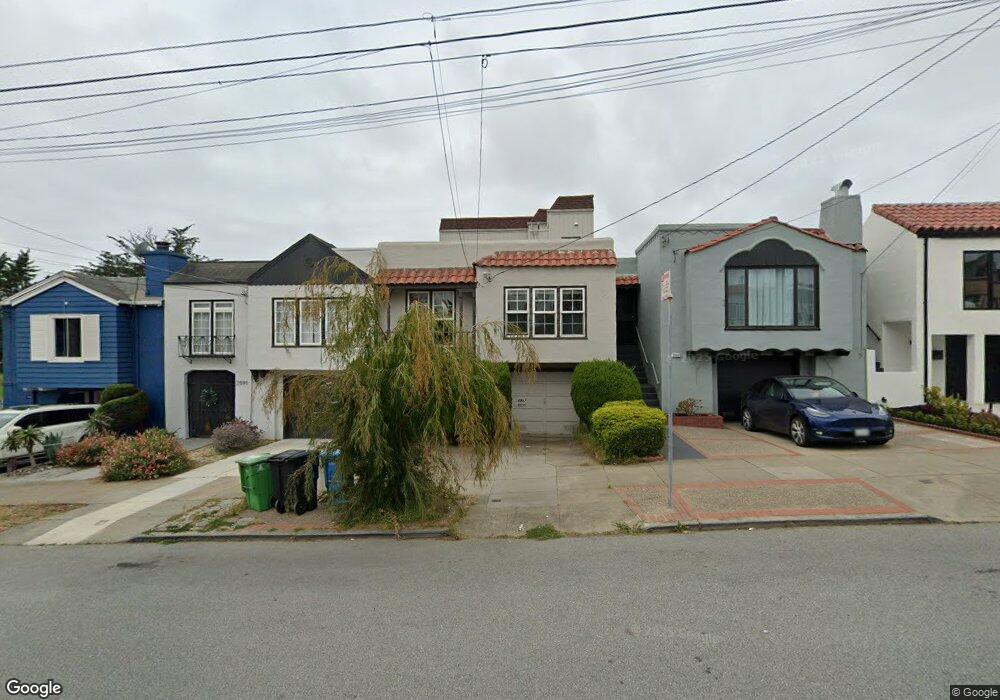
2587 28th Ave San Francisco, CA 94116
Parkside NeighborhoodEstimated Value: $1,891,000 - $2,894,000
6
Beds
4
Baths
2,154
Sq Ft
$1,072/Sq Ft
Est. Value
About This Home
This home is located at 2587 28th Ave, San Francisco, CA 94116 and is currently estimated at $2,308,517, approximately $1,071 per square foot. 2587 28th Ave is a home located in San Francisco County with nearby schools including Dianne Feinstein Elementary, Aptos Middle School, and St. Gabriel School.
Ownership History
Date
Name
Owned For
Owner Type
Purchase Details
Closed on
Mar 17, 2014
Sold by
Kluger Andew M
Bought by
Wong Kelvin Iok Hei
Current Estimated Value
Home Financials for this Owner
Home Financials are based on the most recent Mortgage that was taken out on this home.
Original Mortgage
$629,200
Outstanding Balance
$497,032
Interest Rate
5.5%
Mortgage Type
Adjustable Rate Mortgage/ARM
Estimated Equity
$1,811,485
Purchase Details
Closed on
May 5, 2000
Sold by
Sidney Kluger
Bought by
Kluger Sidney and Kluger Mildred
Create a Home Valuation Report for This Property
The Home Valuation Report is an in-depth analysis detailing your home's value as well as a comparison with similar homes in the area
Home Values in the Area
Average Home Value in this Area
Purchase History
| Date | Buyer | Sale Price | Title Company |
|---|---|---|---|
| Wong Kelvin Iok Hei | $968,000 | Fidelity National Title Co | |
| Kluger Sidney | -- | -- |
Source: Public Records
Mortgage History
| Date | Status | Borrower | Loan Amount |
|---|---|---|---|
| Open | Wong Kelvin Iok Hei | $629,200 |
Source: Public Records
Tax History
| Year | Tax Paid | Tax Assessment Tax Assessment Total Assessment is a certain percentage of the fair market value that is determined by local assessors to be the total taxable value of land and additions on the property. | Land | Improvement |
|---|---|---|---|---|
| 2025 | $15,221 | $1,263,717 | $735,512 | $528,205 |
| 2024 | $15,221 | $1,238,940 | $721,091 | $517,849 |
| 2023 | $14,988 | $1,214,648 | $706,952 | $507,696 |
| 2022 | $14,699 | $1,190,834 | $693,091 | $497,743 |
| 2021 | $14,436 | $1,167,485 | $679,501 | $487,984 |
| 2020 | $14,505 | $1,155,515 | $672,534 | $482,981 |
| 2019 | $14,007 | $1,132,860 | $659,348 | $473,512 |
| 2018 | $13,534 | $1,110,648 | $646,420 | $464,228 |
| 2017 | $13,075 | $1,088,873 | $633,746 | $455,127 |
| 2016 | $12,090 | $1,002,396 | $621,320 | $381,076 |
| 2015 | $11,939 | $987,340 | $611,988 | $375,352 |
| 2014 | $1,190 | $72,522 | $29,006 | $43,516 |
Source: Public Records
Map
Nearby Homes
Your Personal Tour Guide
Ask me questions while you tour the home.