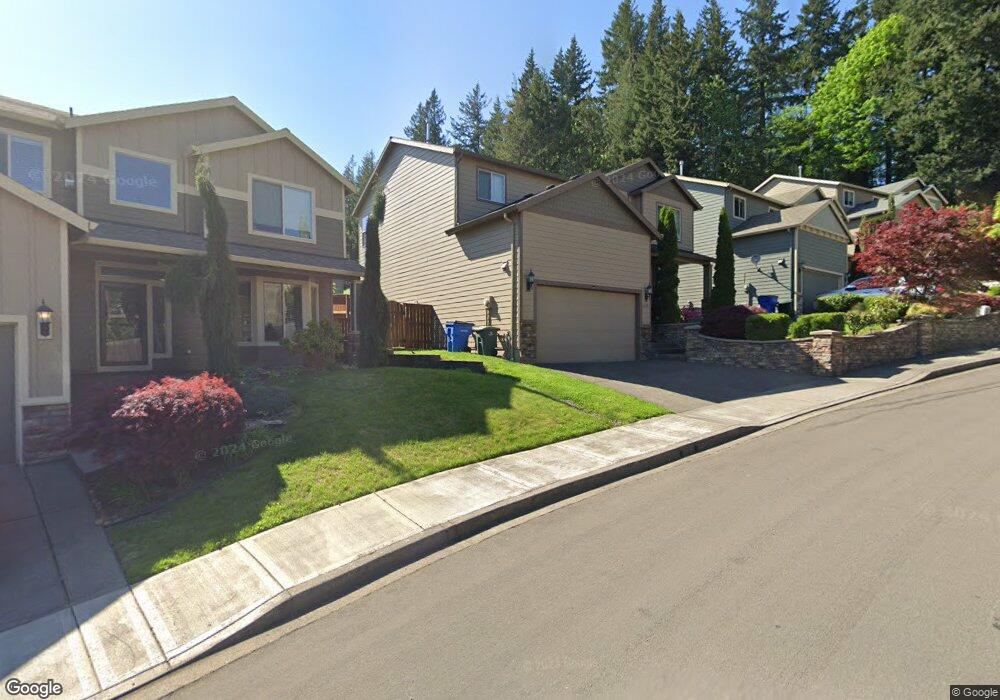
2587 48th St Unit 53 Washougal, WA 98671
Estimated Value: $623,709 - $647,000
4
Beds
3
Baths
2,506
Sq Ft
$253/Sq Ft
Est. Value
About This Home
This home is located at 2587 48th St Unit 53, Washougal, WA 98671 and is currently estimated at $634,927, approximately $253 per square foot. 2587 48th St Unit 53 is a home located in Clark County with nearby schools including Gause Elementary School, Jemtegaard Middle School, and Washougal High School.
Ownership History
Date
Name
Owned For
Owner Type
Purchase Details
Closed on
Mar 24, 2025
Sold by
Aalvik Veronika M and Aalvik Gregory D
Bought by
Valenzuela Staci Lorraine and Valenzuela Ludwing Giovanni
Current Estimated Value
Home Financials for this Owner
Home Financials are based on the most recent Mortgage that was taken out on this home.
Original Mortgage
$430,000
Outstanding Balance
$427,790
Interest Rate
6.85%
Mortgage Type
New Conventional
Estimated Equity
$207,137
Purchase Details
Closed on
Feb 1, 2021
Sold by
Aalvik Veronika M
Bought by
Aalvik Veronika M and Aalvik Gregory D
Home Financials for this Owner
Home Financials are based on the most recent Mortgage that was taken out on this home.
Original Mortgage
$120,000
Interest Rate
2.6%
Mortgage Type
New Conventional
Purchase Details
Closed on
Jul 23, 2019
Sold by
Aalvik Gregory D
Bought by
Aalvik Veronika M and Solis Veronika
Home Financials for this Owner
Home Financials are based on the most recent Mortgage that was taken out on this home.
Original Mortgage
$203,000
Interest Rate
3.82%
Mortgage Type
New Conventional
Purchase Details
Closed on
May 22, 2014
Sold by
Khr Homes Inc
Bought by
Solis Veronika
Home Financials for this Owner
Home Financials are based on the most recent Mortgage that was taken out on this home.
Original Mortgage
$224,000
Interest Rate
4.31%
Mortgage Type
New Conventional
Purchase Details
Closed on
Mar 24, 2011
Sold by
Community Financial Corporation
Bought by
Khr Homes Inc
Home Financials for this Owner
Home Financials are based on the most recent Mortgage that was taken out on this home.
Original Mortgage
$323,400
Interest Rate
4.96%
Mortgage Type
Commercial
Purchase Details
Closed on
Oct 14, 2009
Sold by
Rockford Homes Inc
Bought by
Community Financial Corporation
Purchase Details
Closed on
Apr 26, 2006
Sold by
Columbia View Group Llc
Bought by
Rockford Homes Inc
Home Financials for this Owner
Home Financials are based on the most recent Mortgage that was taken out on this home.
Original Mortgage
$1,789,200
Interest Rate
6.29%
Mortgage Type
Construction
Create a Home Valuation Report for This Property
The Home Valuation Report is an in-depth analysis detailing your home's value as well as a comparison with similar homes in the area
Home Values in the Area
Average Home Value in this Area
Purchase History
| Date | Buyer | Sale Price | Title Company |
|---|---|---|---|
| Valenzuela Staci Lorraine | $635,000 | Fidelity National Title | |
| Aalvik Veronika M | -- | Fidelity Natl Ttl Fishers La | |
| Aalvik Veronika M | -- | Fidelity Natl Ttl Fishers La | |
| Solis Veronika | $279,719 | Columbia Title Agency | |
| Khr Homes Inc | $462,000 | Clark County Title | |
| Community Financial Corporation | $1,339,534 | Fidelity National Title | |
| Rockford Homes Inc | $1,988,000 | First American Title |
Source: Public Records
Mortgage History
| Date | Status | Borrower | Loan Amount |
|---|---|---|---|
| Open | Valenzuela Staci Lorraine | $430,000 | |
| Previous Owner | Aalvik Veronika M | $120,000 | |
| Previous Owner | Aalvik Veronika M | $203,000 | |
| Previous Owner | Solis Veronika | $224,000 | |
| Previous Owner | Khr Homes Inc | $323,400 | |
| Previous Owner | Rockford Homes Inc | $1,789,200 |
Source: Public Records
Tax History Compared to Growth
Tax History
| Year | Tax Paid | Tax Assessment Tax Assessment Total Assessment is a certain percentage of the fair market value that is determined by local assessors to be the total taxable value of land and additions on the property. | Land | Improvement |
|---|---|---|---|---|
| 2025 | $5,097 | $552,587 | $120,000 | $432,587 |
| 2024 | $4,994 | $537,274 | $142,560 | $394,714 |
| 2023 | $5,224 | $551,011 | $164,088 | $386,923 |
| 2022 | $4,740 | $564,483 | $164,088 | $400,395 |
| 2021 | $4,766 | $444,369 | $128,040 | $316,329 |
| 2020 | $4,509 | $419,279 | $120,000 | $299,279 |
| 2019 | $3,921 | $402,929 | $120,000 | $282,929 |
| 2018 | $4,360 | $370,432 | $0 | $0 |
| 2017 | $3,753 | $340,007 | $0 | $0 |
| 2016 | $3,818 | $321,499 | $0 | $0 |
| 2015 | $3,707 | $299,036 | $0 | $0 |
| 2014 | -- | $288,919 | $0 | $0 |
| 2013 | -- | $205,814 | $0 | $0 |
Source: Public Records
Map
Nearby Homes