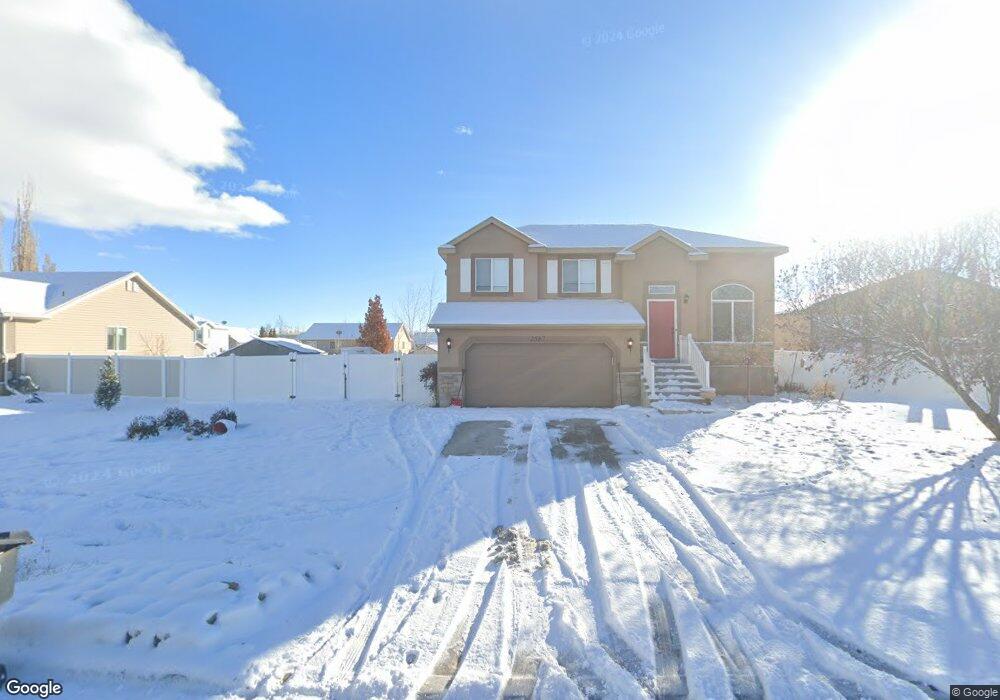
2587 W 2650 N Clearfield, UT 84015
Estimated Value: $486,747 - $508,000
4
Beds
3
Baths
2,025
Sq Ft
$247/Sq Ft
Est. Value
About This Home
This home is located at 2587 W 2650 N, Clearfield, UT 84015 and is currently estimated at $500,187, approximately $247 per square foot. 2587 W 2650 N is a home located in Davis County with nearby schools including West Clinton Elementary School, West Point Junior High School, and Clearfield High School.
Ownership History
Date
Name
Owned For
Owner Type
Purchase Details
Closed on
Jan 10, 2018
Sold by
Barneck Samantha
Bought by
Humpherys Kirk H and Humpherys Jacquelyn R
Current Estimated Value
Home Financials for this Owner
Home Financials are based on the most recent Mortgage that was taken out on this home.
Original Mortgage
$266,581
Outstanding Balance
$222,554
Interest Rate
3.62%
Mortgage Type
FHA
Estimated Equity
$277,633
Purchase Details
Closed on
Jan 4, 2017
Sold by
Lee Herman M and Lee Josefa R
Bought by
Barneck Samantha
Home Financials for this Owner
Home Financials are based on the most recent Mortgage that was taken out on this home.
Original Mortgage
$227,850
Interest Rate
4.13%
Mortgage Type
New Conventional
Purchase Details
Closed on
Mar 31, 2004
Sold by
North Ivory
Bought by
Lee Herman M and Lee Josefa R
Home Financials for this Owner
Home Financials are based on the most recent Mortgage that was taken out on this home.
Original Mortgage
$168,358
Interest Rate
5.57%
Mortgage Type
FHA
Create a Home Valuation Report for This Property
The Home Valuation Report is an in-depth analysis detailing your home's value as well as a comparison with similar homes in the area
Home Values in the Area
Average Home Value in this Area
Purchase History
| Date | Buyer | Sale Price | Title Company |
|---|---|---|---|
| Humpherys Kirk H | -- | Vanguard Title | |
| Barneck Samantha | -- | Inwest Title | |
| Lee Herman M | -- | Bonneville Title Company Inc | |
| North Ivory | -- | Bonneville Title Company Inc |
Source: Public Records
Mortgage History
| Date | Status | Borrower | Loan Amount |
|---|---|---|---|
| Open | Humpherys Kirk H | $266,581 | |
| Previous Owner | Barneck Samantha | $227,850 | |
| Previous Owner | Lee Herman M | $168,358 |
Source: Public Records
Tax History Compared to Growth
Tax History
| Year | Tax Paid | Tax Assessment Tax Assessment Total Assessment is a certain percentage of the fair market value that is determined by local assessors to be the total taxable value of land and additions on the property. | Land | Improvement |
|---|---|---|---|---|
| 2025 | $2,397 | $230,450 | $106,884 | $123,566 |
| 2024 | $2,424 | $234,300 | $115,653 | $118,647 |
| 2023 | $2,287 | $409,000 | $134,812 | $274,188 |
| 2022 | $2,429 | $240,350 | $78,565 | $161,785 |
| 2021 | $2,187 | $321,000 | $105,006 | $215,994 |
| 2020 | $1,907 | $277,000 | $92,940 | $184,060 |
| 2019 | $1,860 | $264,000 | $101,802 | $162,198 |
| 2018 | $1,757 | $245,000 | $85,131 | $159,869 |
| 2016 | $1,429 | $102,850 | $33,896 | $68,954 |
| 2015 | $1,421 | $97,295 | $33,896 | $63,399 |
| 2014 | $1,406 | $97,783 | $33,896 | $63,887 |
| 2013 | -- | $94,014 | $30,183 | $63,831 |
Source: Public Records
Map
Nearby Homes
- 2592 W 2650 N
- 2322 N 2500 W
- 2241 W 2475 N
- 4164 W 5950 S
- 5856 S 3950 W
- 2434 W 2250 N
- 4276 W 6025 S
- 3027 W 2600 N
- 3033 W 2600 N
- 3186 W 2600 N
- 3068 W 2600 N
- 2571 N 3200 W
- 3028 W 2600 N
- 3016 W 2650 N
- 5778 S 4075 W
- 4166 W 5850 S
- Harvard Plan at Summerfield - Enclave
- 2208 W 2615 N
- Linden Plan at Summerfield - Vista
- Yale Plan at Summerfield - Enclave