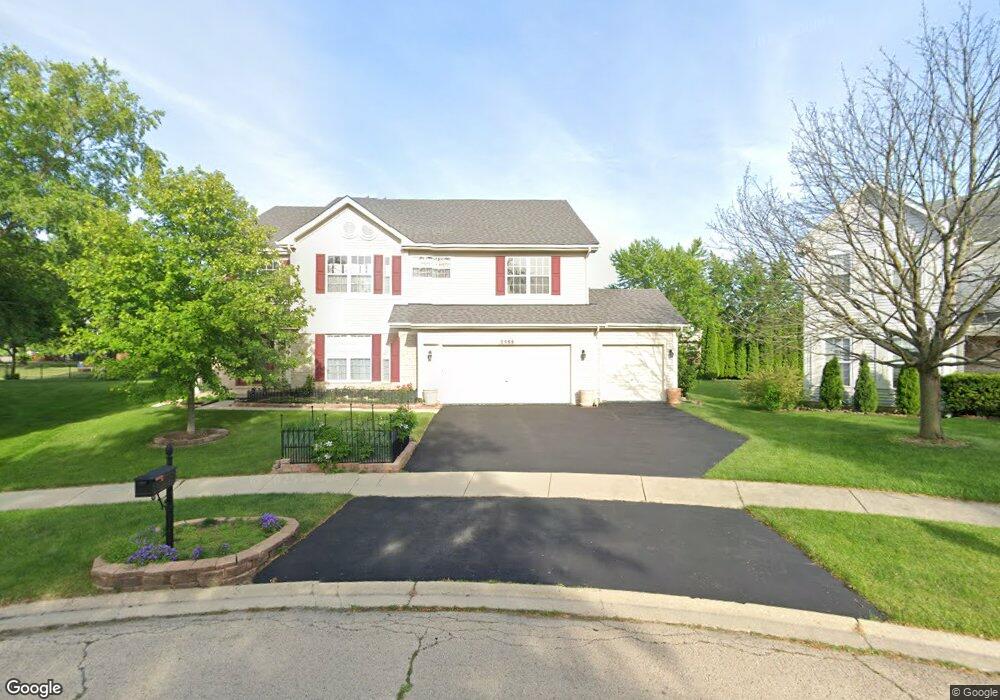
2588 Tahoe Ct Aurora, IL 60503
Far Southeast NeighborhoodEstimated Value: $469,000 - $587,000
--
Bed
1
Bath
4,336
Sq Ft
$125/Sq Ft
Est. Value
About This Home
This home is located at 2588 Tahoe Ct, Aurora, IL 60503 and is currently estimated at $543,436, approximately $125 per square foot. 2588 Tahoe Ct is a home located in Will County with nearby schools including Wolfs Crossing Elementary School, Bednarcik Jr. High School, and Oswego East High School.
Ownership History
Date
Name
Owned For
Owner Type
Purchase Details
Closed on
Sep 26, 2020
Sold by
Hagey Espie Waverly and Espie Meredith R
Bought by
Hagey Espie Waverly
Current Estimated Value
Home Financials for this Owner
Home Financials are based on the most recent Mortgage that was taken out on this home.
Original Mortgage
$555,000
Outstanding Balance
$545,561
Interest Rate
3.08%
Mortgage Type
Reverse Mortgage Home Equity Conversion Mortgage
Estimated Equity
-$2,125
Purchase Details
Closed on
Apr 18, 2000
Sold by
Lakewood Valley Llc
Bought by
Hagey Espie Waverly and Espie Meredith R
Home Financials for this Owner
Home Financials are based on the most recent Mortgage that was taken out on this home.
Original Mortgage
$300,900
Interest Rate
7.62%
Create a Home Valuation Report for This Property
The Home Valuation Report is an in-depth analysis detailing your home's value as well as a comparison with similar homes in the area
Home Values in the Area
Average Home Value in this Area
Purchase History
| Date | Buyer | Sale Price | Title Company |
|---|---|---|---|
| Hagey Espie Waverly | -- | Fnc Title Services Llc | |
| Hagey Espie Waverly | $334,500 | Chicago Title Insurance Co |
Source: Public Records
Mortgage History
| Date | Status | Borrower | Loan Amount |
|---|---|---|---|
| Open | Hagey Espie Waverly | $555,000 | |
| Closed | Hagey Espie Waverly | $300,900 |
Source: Public Records
Tax History Compared to Growth
Tax History
| Year | Tax Paid | Tax Assessment Tax Assessment Total Assessment is a certain percentage of the fair market value that is determined by local assessors to be the total taxable value of land and additions on the property. | Land | Improvement |
|---|---|---|---|---|
| 2024 | $15,027 | $188,405 | $23,259 | $165,146 |
| 2023 | $15,027 | $166,436 | $20,547 | $145,889 |
| 2022 | $12,633 | $137,949 | $19,437 | $118,512 |
| 2021 | $12,633 | $131,380 | $18,511 | $112,869 |
| 2020 | $11,999 | $129,299 | $18,218 | $111,081 |
| 2019 | $12,116 | $125,655 | $17,705 | $107,950 |
| 2018 | $10,522 | $107,173 | $17,315 | $89,858 |
| 2017 | $10,401 | $104,406 | $16,868 | $87,538 |
| 2016 | $10,653 | $102,159 | $16,505 | $85,654 |
| 2015 | $11,189 | $98,230 | $15,870 | $82,360 |
| 2014 | $11,189 | $98,230 | $15,870 | $82,360 |
| 2013 | $11,189 | $98,230 | $15,870 | $82,360 |
Source: Public Records
Map
Nearby Homes
- 2532 Sagamore Cir
- 2969 Francis Ct
- 2895 Lahinch Ct Unit 6
- 2735 Hillsboro Blvd Unit 3
- 2746 Hillsboro Blvd
- 2723 Hillsboro Blvd
- 9836 S Carls Dr
- 2495 Hafenrichter Rd
- 2413 Dickens Dr
- 2326 Sunshine Ln Unit 1969
- 2357 Twilight Dr
- 2566 Rourke Dr
- 2232 Daybreak Dr
- 2234 Daybreak Dr
- 4446 Monroe Ct
- 2310 Twilight Dr
- 4449 Monroe Ct
- 2295 Twilight Dr
- 2197 Wilson Creek Cir Unit 3
- 3288 Wildlight Rd
- 2578 Tahoe Ct
- 2598 Tahoe Ct
- 2597 Wild Dunes Cir
- 2587 Wild Dunes Cir Unit 3
- 2607 Wild Dunes Cir
- 2555 Royal Troon Dr
- 2607 Tahoe Ct
- 2545 Royal Troon Dr
- 2568 Tahoe Ct
- 2565 Royal Troon Dr
- 2548 Tahoe Ct
- 2587 Tahoe Ct Unit 3
- 2577 Tahoe Ct
- 2634 Canyon Ct
- 2644 Canyon Ct
- 2602 Wild Dunes Cir
- 2594 Wild Dunes Cir
- 2567 Tahoe Ct
- 2586 Wild Dunes Cir
- 1644 Imperial Valley Trail