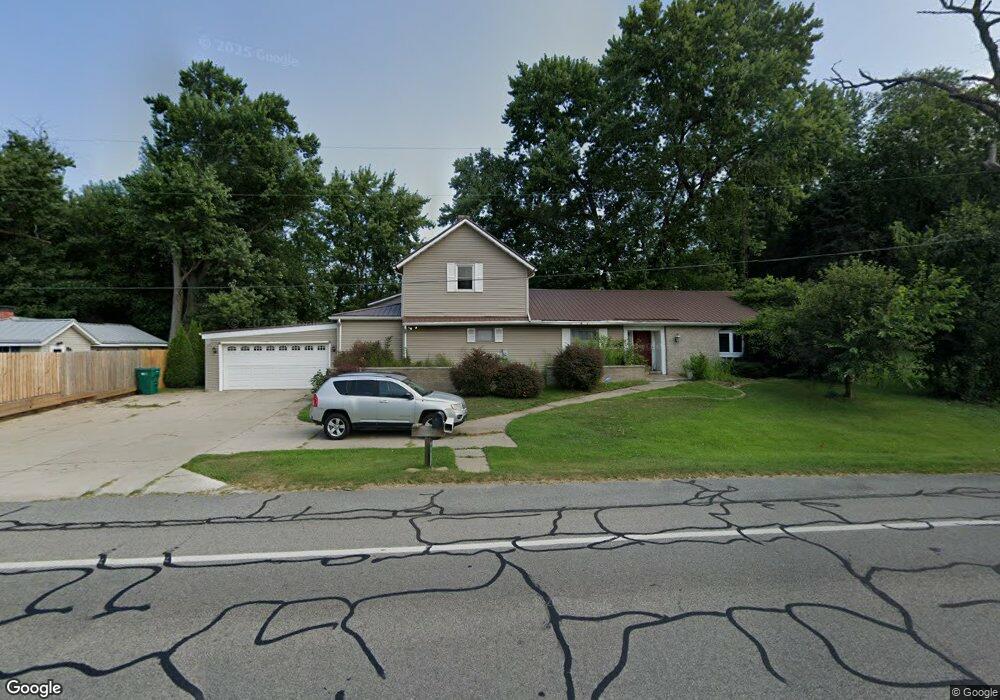
25889 Us Highway 20 South Bend, IN 46628
Estimated Value: $306,000 - $561,255
3
Beds
3
Baths
3,598
Sq Ft
$119/Sq Ft
Est. Value
About This Home
This home is located at 25889 Us Highway 20, South Bend, IN 46628 and is currently estimated at $426,752, approximately $118 per square foot. 25889 Us Highway 20 is a home located in St. Joseph County with nearby schools including Warren Elementary School, Clay Intermediate Center, and Dickinson Fine Arts Academy.
Ownership History
Date
Name
Owned For
Owner Type
Purchase Details
Closed on
May 6, 2020
Sold by
Allen Mills Lucus
Bought by
Mills Lucus Allen and Mills Maureen
Current Estimated Value
Home Financials for this Owner
Home Financials are based on the most recent Mortgage that was taken out on this home.
Original Mortgage
$249,347
Outstanding Balance
$221,779
Interest Rate
3.5%
Mortgage Type
FHA
Estimated Equity
$204,973
Purchase Details
Closed on
May 20, 2019
Sold by
Sones Trust
Bought by
Mills Lucas Allen and Mills Maureen
Home Financials for this Owner
Home Financials are based on the most recent Mortgage that was taken out on this home.
Original Mortgage
$248,417
Interest Rate
5.12%
Mortgage Type
FHA
Purchase Details
Closed on
Feb 29, 2008
Sold by
Sones Robert and Sones Robert L
Bought by
Sones Geneva L and The Geneva L Sones Revocable Living Trus
Purchase Details
Closed on
Apr 21, 2005
Sold by
Sones Robert and Sones Robert L
Bought by
Sones Robert and Sones Geneva L
Create a Home Valuation Report for This Property
The Home Valuation Report is an in-depth analysis detailing your home's value as well as a comparison with similar homes in the area
Home Values in the Area
Average Home Value in this Area
Purchase History
| Date | Buyer | Sale Price | Title Company |
|---|---|---|---|
| Mills Lucus Allen | $251,840 | None Listed On Document | |
| Mills Lucas Allen | -- | None Available | |
| Sones Geneva L | -- | None Available | |
| Sones Robert | -- | None Available |
Source: Public Records
Mortgage History
| Date | Status | Borrower | Loan Amount |
|---|---|---|---|
| Open | Mills Lucus Allen | $249,347 | |
| Previous Owner | Mills Lucas Allen | $248,417 |
Source: Public Records
Tax History Compared to Growth
Tax History
| Year | Tax Paid | Tax Assessment Tax Assessment Total Assessment is a certain percentage of the fair market value that is determined by local assessors to be the total taxable value of land and additions on the property. | Land | Improvement |
|---|---|---|---|---|
| 2024 | $6,659 | $418,400 | $206,900 | $211,500 |
| 2023 | $6,616 | $424,100 | $206,900 | $217,200 |
| 2022 | $6,764 | $424,100 | $206,900 | $217,200 |
| 2021 | $4,993 | $309,300 | $111,200 | $198,100 |
| 2020 | $4,650 | $291,200 | $104,400 | $186,800 |
| 2019 | $2,975 | $134,300 | $17,400 | $116,900 |
| 2018 | $1,351 | $138,800 | $35,800 | $103,000 |
| 2017 | $1,274 | $128,400 | $35,800 | $92,600 |
| 2016 | $1,293 | $128,400 | $35,800 | $92,600 |
| 2014 | $1,778 | $151,000 | $23,400 | $127,600 |
Source: Public Records
Map
Nearby Homes
- 25860 Running Creek Dr
- 53182 Grassy Knoll Dr
- 53170 Grassy Knoll Dr
- 53140 Flowing Stream Ct
- 53128 Flowing Stream Ct
- 25684 Rolling Hills Dr
- 25655 Rolling Hills Dr
- The Ara Plan at Terre Verde Hills
- The Rockne Plan at Terre Verde Hills
- The Leahy Plan at Terre Verde Hills
- The Kelley Plan at Terre Verde Hills
- The Sorin Plan at Terre Verde Hills
- The Badin Plan at Terre Verde Hills
- The Gipper Plan at Terre Verde Hills
- 53705 Terre Verde Hills Ct
- 53748 Terre Verde Hills Ct
- VL Kenmore Dr
- 26428 US Highway 20
- 25700 Lakewood Dr
- 52931 Primrose Rd
- 25889 Highway 20
- 25889 Us Highway 20
- 25891 U S 20
- 25891 Highway 20
- 25920 Us Highway 20
- 25701 Us Highway 20
- 26086 Us Highway 20
- 25685 Us Highway 20
- 25659 Us Highway 20
- 25641 Us Highway 20
- 53473 Poppy Rd
- 26017 Us Highway 20
- 25808 Running Creek Dr
- 25826 Running Creek Dr
- 25844 Running Creek Dr
- 53204 Grassy Knoll Dr
- 25601 Us Highway 20
- 25888 Running Creek Dr
- 53525 Poppy Rd
- 25904 Running Creek Dr