
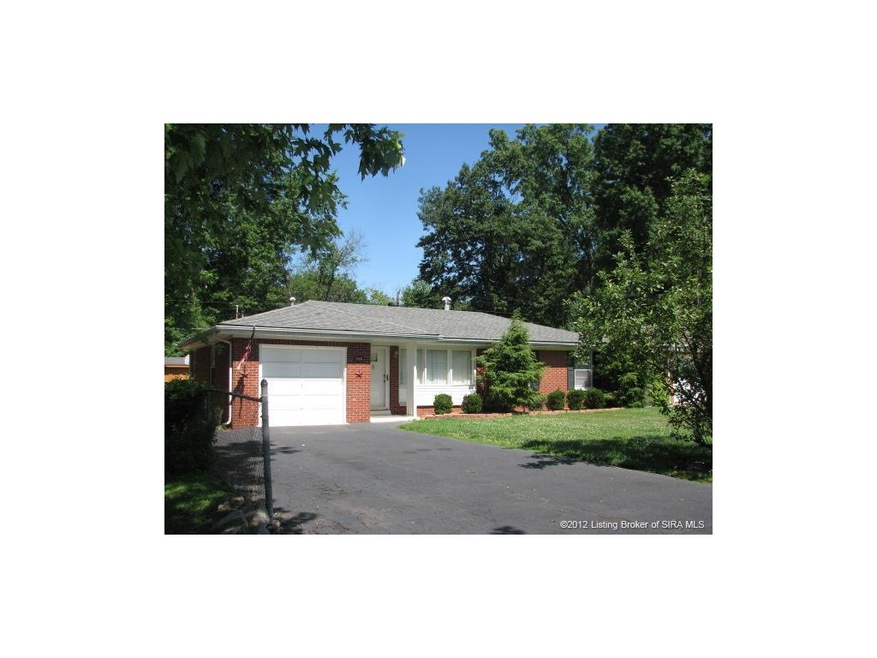
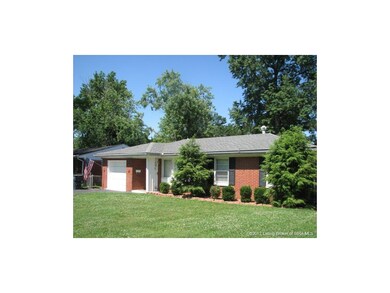
2589 W Robin Rd New Albany, IN 47150
3
Beds
1
Bath
1,116
Sq Ft
7,841
Sq Ft Lot
Highlights
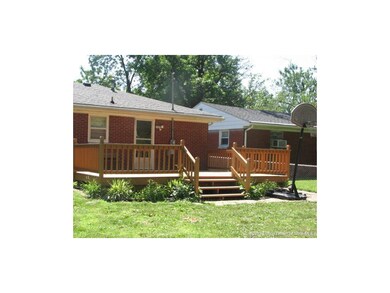
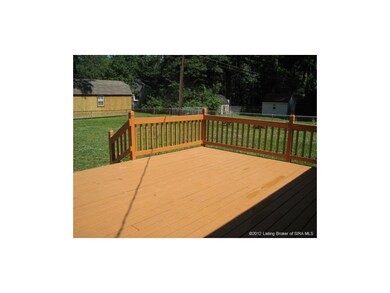
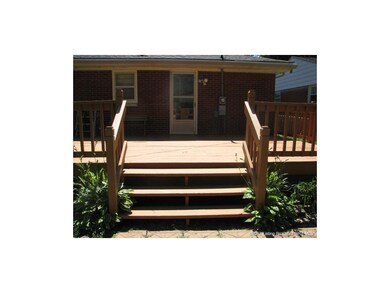
- Deck
- Fenced Yard
- Eat-In Kitchen
- First Floor Utility Room
- 1 Car Attached Garage
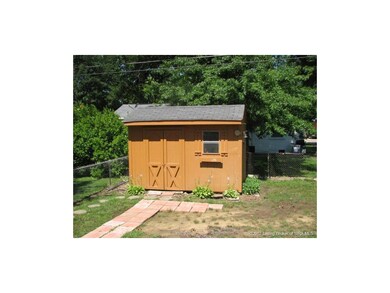
- Shed
About This Home
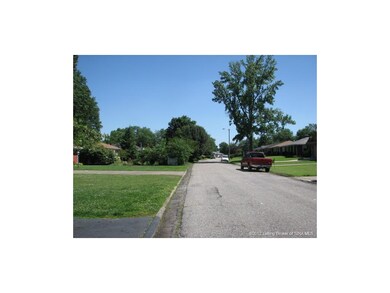
As of January 20203 Bedrooms,all Brick Ranch with attached 1 car garage, fenced yard,large deck and shed,Has utility rooms, convenient quiet neighborhood close to all the activity without all the traffic.One Year Home Warranty, Call for your special showing
Home Details
Home Type
- Single Family
Est. Annual Taxes
- $500
Year Built
- Built in 1955
Lot Details
- 7,841 Sq Ft Lot
- Fenced Yard
Parking
- 1 Car Attached Garage
- Garage Door Opener
- Driveway
- Off-Street Parking
Home Design
- Block Foundation
- Frame Construction
Interior Spaces
- 1,116 Sq Ft Home
- 1-Story Property
- Ceiling Fan
- First Floor Utility Room
Kitchen
- Eat-In Kitchen
- Oven or Range
- Disposal
Bedrooms and Bathrooms
- 3 Bedrooms
- 1 Full Bathroom
- Ceramic Tile in Bathrooms
Laundry
- Dryer
- Washer
Basement
- Sump Pump
- Crawl Space
Outdoor Features
- Deck
- Shed
Utilities
- Forced Air Heating and Cooling System
- Natural Gas Water Heater
- Cable TV Available
Listing and Financial Details
- Home warranty included in the sale of the property
- Assessor Parcel Number 220504301410000008
Ownership History
Date
Name
Owned For
Owner Type
Purchase Details
Listed on
Jul 20, 2019
Closed on
Jan 28, 2020
Sold by
Cm Property Solutions Llc
Bought by
Strauss Lauren
Seller's Agent
Michael Dooley
Compass REALTORS, LLC
Buyer's Agent
Aaron Hupp
Green Tree Real Estate Services
List Price
$147,000
Sold Price
$143,000
Premium/Discount to List
-$4,000
-2.72%
Current Estimated Value
Home Financials for this Owner
Home Financials are based on the most recent Mortgage that was taken out on this home.
Estimated Appreciation
$74,593
Avg. Annual Appreciation
6.39%
Original Mortgage
$140,409
Interest Rate
5.12%
Mortgage Type
FHA
Purchase Details
Listed on
Oct 3, 2018
Closed on
Dec 26, 2018
Sold by
Hud
Bought by
Cm Property Solutions Llc
Seller's Agent
Reed Martin
RE/MAX FIRST-Commercial Group
Buyer's Agent
John Davis
United Real Estate Louisville
List Price
$75,000
Sold Price
$68,000
Premium/Discount to List
-$7,000
-9.33%
Home Financials for this Owner
Home Financials are based on the most recent Mortgage that was taken out on this home.
Avg. Annual Appreciation
99.03%
Original Mortgage
$106,264
Interest Rate
4.8%
Mortgage Type
Balloon
Purchase Details
Closed on
Jul 24, 2018
Sold by
Us Bank Na
Bought by
Hud
Purchase Details
Closed on
Apr 27, 2018
Sold by
Floyd County Sheriff
Bought by
Us Bank Na
Similar Homes in New Albany, IN
Create a Home Valuation Report for This Property
The Home Valuation Report is an in-depth analysis detailing your home's value as well as a comparison with similar homes in the area
Home Values in the Area
Average Home Value in this Area
Purchase History
| Date | Type | Sale Price | Title Company |
|---|---|---|---|
| Deed | -- | None Available | |
| Special Warranty Deed | -- | None Available | |
| Warranty Deed | -- | None Available | |
| Sheriffs Deed | $72,527 | None Available |
Source: Public Records
Mortgage History
| Date | Status | Loan Amount | Loan Type |
|---|---|---|---|
| Open | $140,409 | New Conventional | |
| Closed | $35,000 | New Conventional | |
| Closed | $140,409 | FHA | |
| Previous Owner | $106,264 | Balloon | |
| Previous Owner | $77,569 | FHA | |
| Previous Owner | $3,160 | New Conventional |
Source: Public Records
Property History
| Date | Event | Price | Change | Sq Ft Price |
|---|---|---|---|---|
| 01/28/2020 01/28/20 | Sold | $143,000 | -2.1% | $128 / Sq Ft |
| 12/07/2019 12/07/19 | Pending | -- | -- | -- |
| 11/29/2019 11/29/19 | Price Changed | $146,000 | -0.7% | $130 / Sq Ft |
| 11/26/2019 11/26/19 | Price Changed | $147,000 | -1.3% | $131 / Sq Ft |
| 11/23/2019 11/23/19 | Price Changed | $149,000 | -0.6% | $133 / Sq Ft |
| 11/14/2019 11/14/19 | Price Changed | $149,900 | -0.1% | $134 / Sq Ft |
| 11/04/2019 11/04/19 | Price Changed | $150,000 | -11.8% | $134 / Sq Ft |
| 10/02/2019 10/02/19 | Price Changed | $170,000 | +17.2% | $152 / Sq Ft |
| 09/26/2019 09/26/19 | Price Changed | $145,000 | -1.4% | $129 / Sq Ft |
| 09/19/2019 09/19/19 | For Sale | $147,000 | 0.0% | $131 / Sq Ft |
| 08/13/2019 08/13/19 | Pending | -- | -- | -- |
| 08/06/2019 08/06/19 | Price Changed | $147,000 | -0.4% | $131 / Sq Ft |
| 07/20/2019 07/20/19 | For Sale | $147,600 | +117.1% | $132 / Sq Ft |
| 12/28/2018 12/28/18 | Sold | $68,000 | -9.3% | $61 / Sq Ft |
| 10/23/2018 10/23/18 | Pending | -- | -- | -- |
| 10/03/2018 10/03/18 | For Sale | $75,000 | -5.1% | $67 / Sq Ft |
| 10/28/2012 10/28/12 | Sold | $79,000 | -5.8% | $71 / Sq Ft |
| 10/04/2012 10/04/12 | Pending | -- | -- | -- |
| 06/02/2012 06/02/12 | For Sale | $83,900 | -- | $75 / Sq Ft |
Source: Southern Indiana REALTORS® Association
Tax History Compared to Growth
Tax History
| Year | Tax Paid | Tax Assessment Tax Assessment Total Assessment is a certain percentage of the fair market value that is determined by local assessors to be the total taxable value of land and additions on the property. | Land | Improvement |
|---|---|---|---|---|
| 2024 | $2,946 | $156,600 | $14,100 | $142,500 |
| 2023 | $2,946 | $137,400 | $14,100 | $123,300 |
| 2022 | $2,714 | $126,500 | $14,100 | $112,400 |
| 2021 | $2,552 | $118,000 | $14,100 | $103,900 |
| 2020 | $2,362 | $109,100 | $14,100 | $95,000 |
| 2019 | $2,087 | $96,400 | $14,100 | $82,300 |
| 2018 | $763 | $95,500 | $14,100 | $81,400 |
| 2017 | $1,171 | $89,000 | $14,100 | $74,900 |
| 2016 | $895 | $88,200 | $14,100 | $74,100 |
| 2014 | $608 | $84,500 | $14,100 | $70,400 |
| 2013 | -- | $75,900 | $14,100 | $61,800 |
Source: Public Records
Agents Affiliated with this Home
-
Michael Dooley
M
Seller's Agent in 2020
Michael Dooley
Compass REALTORS, LLC
(502) 727-9381
3 in this area
15 Total Sales
-
Aaron Hupp
A
Buyer's Agent in 2020
Aaron Hupp
Green Tree Real Estate Services
(502) 639-5182
5 in this area
11 Total Sales
-
Reed Martin
Seller's Agent in 2018
Reed Martin
RE/MAX
(502) 741-1391
52 in this area
281 Total Sales
-
John Davis
Buyer's Agent in 2018
John Davis
United Real Estate Louisville
(502) 528-5368
7 in this area
105 Total Sales
-
Jim Cash
Seller's Agent in 2012
Jim Cash
Southern Realty
(502) 608-2307
4 in this area
49 Total Sales
-
Angela Bauer
Buyer's Agent in 2012
Angela Bauer
RE/MAX
(502) 773-2304
47 in this area
196 Total Sales
Map
Source: Southern Indiana REALTORS® Association
MLS Number: 201203993
APN: 22-05-04-301-410.000-008
Disclaimer: Certain information contained herein is derived from information provided by parties other than Homes.com. All information provided is deemed reliable, but is not guaranteed to be accurate and should be independently verified.
![]() IDX information is provided exclusively for consumers’ personal, noncommercial use, and it may not be used for any purpose other than to identify prospective properties consumers may be interested in purchasing. Listing data is deemed reliable but is not guaranteed accurate by the SIRA MLS.
IDX information is provided exclusively for consumers’ personal, noncommercial use, and it may not be used for any purpose other than to identify prospective properties consumers may be interested in purchasing. Listing data is deemed reliable but is not guaranteed accurate by the SIRA MLS.
Nearby Homes
- 8 Robin Ct
- 2550 Broadway St
- 823 Elmwood Ave
- 20 Oxford Dr
- 6369 Indiana 111
- 1714 McDonald Ln
- 2406 Fairmont Ave
- 2315 Alta Ave
- 1672 Garretson Ln
- 1640 Oriole Dr
- 2705 Charlestown Rd
- 528 Drawbrook Cir
- 2109 Loop Island Way
- 2105 Loop Island Way
- 1409 Slate Run Rd Unit 5
- 1418 Vance Ave
- 605 E Daisy Ln
- 1918 Charlestown Rd
- 2127 Willard Ave
- 1689 Old Ford Rd