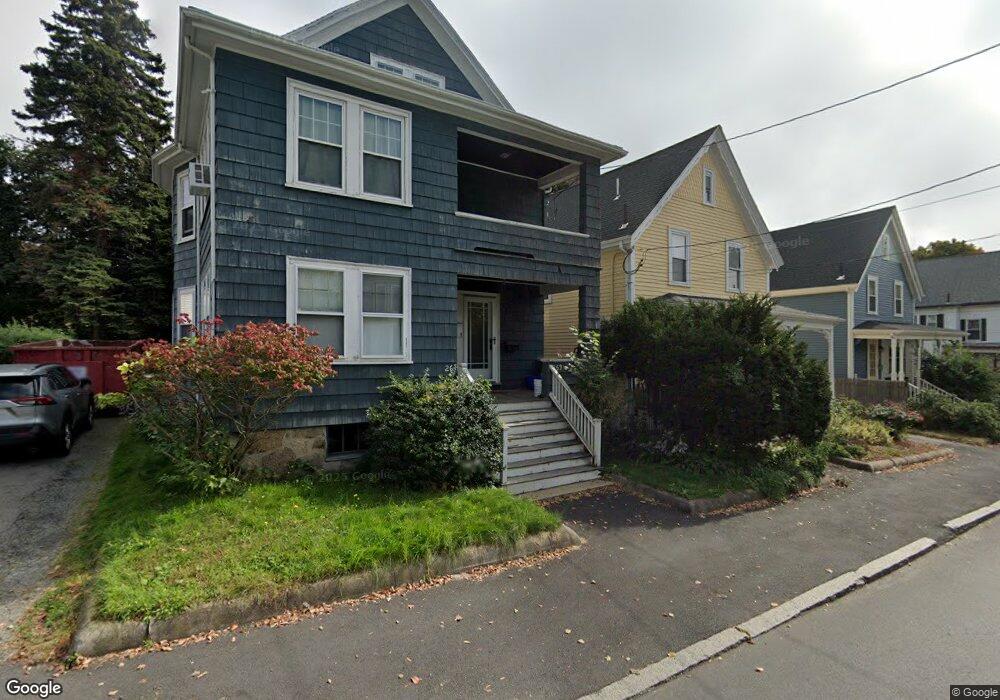
259 Burrill St Swampscott, MA 01907
Estimated Value: $621,000 - $847,000
4
Beds
2
Baths
2,523
Sq Ft
$300/Sq Ft
Est. Value
About This Home
This home is located at 259 Burrill St, Swampscott, MA 01907 and is currently estimated at $756,275, approximately $299 per square foot. 259 Burrill St is a home located in Essex County with nearby schools including Swampscott Middle School and Swampscott High School.
Ownership History
Date
Name
Owned For
Owner Type
Purchase Details
Closed on
Jun 10, 2021
Sold by
Mosho Stephen S and Mosho Donna
Bought by
Mosho Monica and Andrews Daniel
Current Estimated Value
Home Financials for this Owner
Home Financials are based on the most recent Mortgage that was taken out on this home.
Original Mortgage
$320,000
Outstanding Balance
$288,455
Interest Rate
2.9%
Mortgage Type
Purchase Money Mortgage
Estimated Equity
$467,820
Purchase Details
Closed on
Mar 19, 2010
Sold by
Mosho Fannie
Bought by
Mosho Benjamin H and Mosho Michael W
Purchase Details
Closed on
Nov 27, 1985
Bought by
Mosho Stephen S and Mosho Donna
Create a Home Valuation Report for This Property
The Home Valuation Report is an in-depth analysis detailing your home's value as well as a comparison with similar homes in the area
Home Values in the Area
Average Home Value in this Area
Purchase History
| Date | Buyer | Sale Price | Title Company |
|---|---|---|---|
| Mosho Monica | $400,000 | None Available | |
| Mosho Benjamin H | -- | -- | |
| Mosho Benjamin H | -- | -- | |
| Mosho Stephen S | -- | -- |
Source: Public Records
Mortgage History
| Date | Status | Borrower | Loan Amount |
|---|---|---|---|
| Open | Mosho Monica | $320,000 | |
| Previous Owner | Mosho Stephen S | $50,000 |
Source: Public Records
Tax History Compared to Growth
Tax History
| Year | Tax Paid | Tax Assessment Tax Assessment Total Assessment is a certain percentage of the fair market value that is determined by local assessors to be the total taxable value of land and additions on the property. | Land | Improvement |
|---|---|---|---|---|
| 2025 | $7,410 | $646,000 | $226,500 | $419,500 |
| 2024 | $7,273 | $633,000 | $215,700 | $417,300 |
| 2023 | $7,105 | $605,200 | $199,800 | $405,400 |
| 2022 | $6,955 | $542,100 | $167,800 | $374,300 |
| 2021 | $6,710 | $486,200 | $143,800 | $342,400 |
| 2020 | $6,115 | $427,600 | $127,800 | $299,800 |
| 2019 | $5,934 | $390,400 | $111,900 | $278,500 |
| 2018 | $5,949 | $371,800 | $103,900 | $267,900 |
| 2017 | $5,331 | $305,500 | $75,900 | $229,600 |
| 2016 | $4,915 | $283,600 | $64,700 | $218,900 |
| 2015 | $4,864 | $283,600 | $64,700 | $218,900 |
| 2014 | $4,995 | $267,100 | $64,700 | $202,400 |
Source: Public Records
Map
Nearby Homes
- 106 Norfolk Ave
- 80 Norfolk Ave Unit 1
- 189 Burrill St Unit 2
- 29-31 Essex Ave Unit 2
- 76 Stetson Ave
- 98 Paradise Rd
- 44 Cherry St Unit 2
- 100 Burpee Rd
- 30 Paradise Rd
- 133 Eastern Ave Unit 8
- 51 Barnstable St
- 108-110 Burrill St Unit 1
- 35 Columbia Ave
- 59 Essex St Unit 59B
- 7-9 Rock Ave
- 28 Claremont Terrace Unit 4
- 28 Claremont Terrace Unit 6
- 306 Paradise Rd
- 26 Groveland St
- 309 Paradise Rd