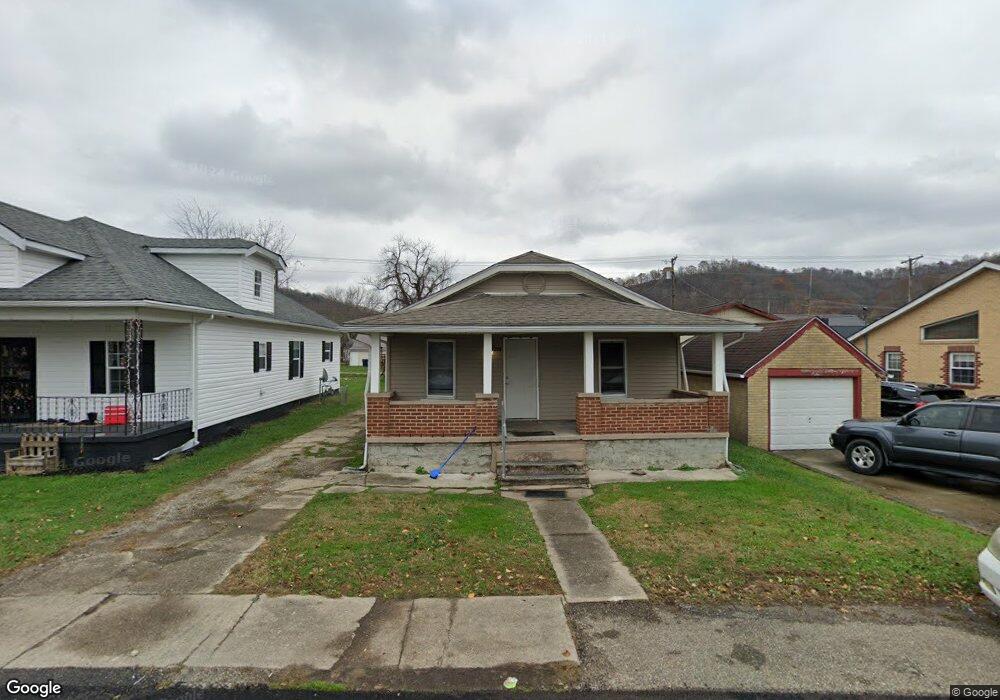
259 E 4th Ave South Shore, KY 41175
Estimated Value: $42,000 - $134,000
2
Beds
1
Bath
1,040
Sq Ft
$80/Sq Ft
Est. Value
About This Home
This home is located at 259 E 4th Ave, South Shore, KY 41175 and is currently estimated at $83,158, approximately $79 per square foot. 259 E 4th Ave is a home with nearby schools including Greenup County High School, Notre Dame Elementary School, and Portsmouth Stem Academy.
Ownership History
Date
Name
Owned For
Owner Type
Purchase Details
Closed on
Sep 22, 2017
Sold by
Meenach Properties Llc
Bought by
Fox Ventures Llc
Current Estimated Value
Home Financials for this Owner
Home Financials are based on the most recent Mortgage that was taken out on this home.
Original Mortgage
$60,000
Outstanding Balance
$41,118
Interest Rate
3.86%
Mortgage Type
New Conventional
Estimated Equity
$42,040
Purchase Details
Closed on
Aug 23, 2010
Sold by
Keen Rodney D and Keen Tina L
Bought by
Meenach Properties Llc
Create a Home Valuation Report for This Property
The Home Valuation Report is an in-depth analysis detailing your home's value as well as a comparison with similar homes in the area
Home Values in the Area
Average Home Value in this Area
Purchase History
| Date | Buyer | Sale Price | Title Company |
|---|---|---|---|
| Fox Ventures Llc | -- | None Available | |
| Meenach Properties Llc | $23,472 | -- |
Source: Public Records
Mortgage History
| Date | Status | Borrower | Loan Amount |
|---|---|---|---|
| Open | Fox Ventures Llc | $60,000 |
Source: Public Records
Tax History Compared to Growth
Tax History
| Year | Tax Paid | Tax Assessment Tax Assessment Total Assessment is a certain percentage of the fair market value that is determined by local assessors to be the total taxable value of land and additions on the property. | Land | Improvement |
|---|---|---|---|---|
| 2025 | $790 | $40,000 | $10,000 | $30,000 |
| 2024 | $786 | $40,000 | $10,000 | $30,000 |
| 2023 | $746 | $40,000 | $10,000 | $30,000 |
| 2022 | $728 | $40,000 | $10,000 | $30,000 |
| 2021 | $724 | $40,000 | $10,000 | $30,000 |
| 2020 | $702 | $40,000 | $10,000 | $30,000 |
| 2019 | $730 | $40,000 | $10,000 | $30,000 |
| 2018 | $747 | $40,000 | $10,000 | $30,000 |
| 2017 | $599 | $33,472 | $6,000 | $27,472 |
| 2016 | $599 | $33,472 | $6,000 | $27,472 |
| 2015 | $592 | $33,472 | $6,000 | $27,472 |
| 2014 | $583 | $33,472 | $6,000 | $27,472 |
| 2011 | -- | $23,472 | $6,000 | $17,472 |
Source: Public Records
Map
Nearby Homes