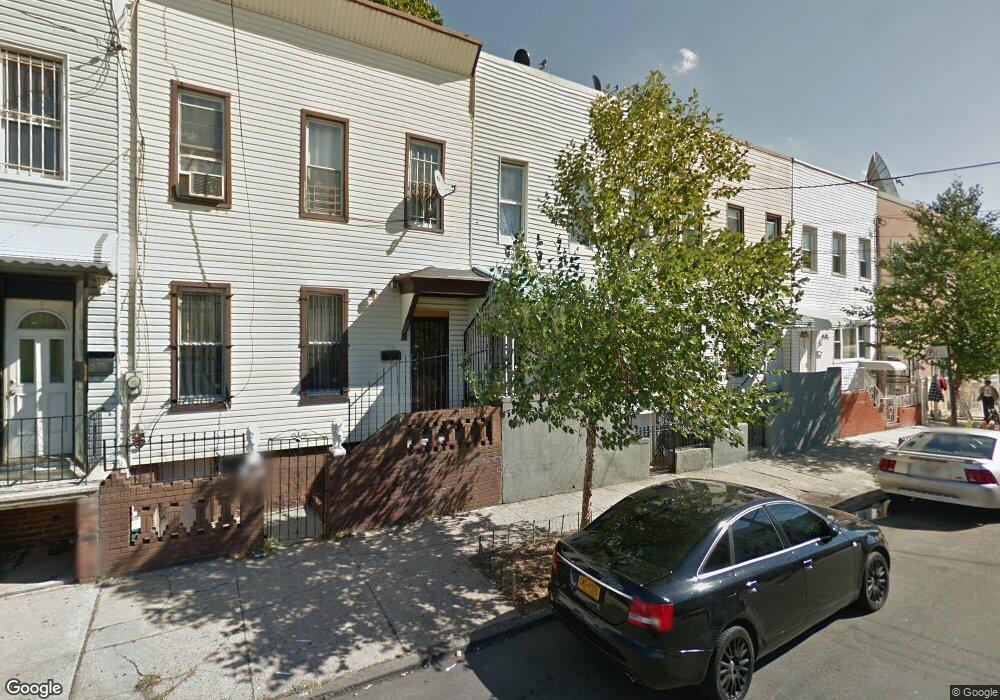
259 Linwood St Brooklyn, NY 11208
Cypress Hills NeighborhoodEstimated Value: $479,000 - $746,000
--
Bed
--
Bath
1,120
Sq Ft
$541/Sq Ft
Est. Value
About This Home
This home is located at 259 Linwood St, Brooklyn, NY 11208 and is currently estimated at $605,407, approximately $540 per square foot. 259 Linwood St is a home located in Kings County with nearby schools including P.S. 108 - Sal Abbracciamento, Liberty Avenue Middle School, and Vista Academy.
Ownership History
Date
Name
Owned For
Owner Type
Purchase Details
Closed on
Jul 26, 2006
Sold by
Dennis-Sheppard Nayland and Greaves Linton
Bought by
Greaves Linton
Current Estimated Value
Purchase Details
Closed on
Aug 22, 2005
Sold by
Greaves Linton
Bought by
Greaves Linton and Sheppard Nayland Dennis
Purchase Details
Closed on
Jul 30, 2002
Sold by
Ferrier Michael A Esq
Bought by
Secretary Of Housing And Urban Developme
Purchase Details
Closed on
Nov 9, 2001
Sold by
Welch Genevienve
Bought by
274 Ridgewood Corp
Purchase Details
Closed on
Mar 21, 1995
Sold by
Khani Soleyman
Bought by
Welch Genevieve
Home Financials for this Owner
Home Financials are based on the most recent Mortgage that was taken out on this home.
Original Mortgage
$126,750
Interest Rate
8.55%
Mortgage Type
FHA
Create a Home Valuation Report for This Property
The Home Valuation Report is an in-depth analysis detailing your home's value as well as a comparison with similar homes in the area
Home Values in the Area
Average Home Value in this Area
Purchase History
| Date | Buyer | Sale Price | Title Company |
|---|---|---|---|
| Greaves Linton | -- | -- | |
| Greaves Linton | -- | -- | |
| Greaves Linton | -- | -- | |
| Greaves Linton | -- | -- | |
| Secretary Of Housing And Urban Developme | -- | -- | |
| Secretary Of Housing And Urban Developme | -- | -- | |
| 274 Ridgewood Corp | -- | -- | |
| 274 Ridgewood Corp | -- | -- | |
| Welch Genevieve | $125,000 | Commonwealth Land Title Ins | |
| Welch Genevieve | $125,000 | Commonwealth Land Title Ins |
Source: Public Records
Mortgage History
| Date | Status | Borrower | Loan Amount |
|---|---|---|---|
| Previous Owner | Welch Genevieve | $126,750 | |
| Closed | Greaves Linton | $0 |
Source: Public Records
Tax History Compared to Growth
Tax History
| Year | Tax Paid | Tax Assessment Tax Assessment Total Assessment is a certain percentage of the fair market value that is determined by local assessors to be the total taxable value of land and additions on the property. | Land | Improvement |
|---|---|---|---|---|
| 2025 | $2,380 | $30,240 | $5,100 | $25,140 |
| 2024 | $2,380 | $35,580 | $5,100 | $30,480 |
| 2023 | $2,270 | $31,440 | $5,100 | $26,340 |
| 2022 | $2,106 | $29,580 | $5,100 | $24,480 |
| 2021 | $2,095 | $31,800 | $5,100 | $26,700 |
| 2020 | $1,041 | $26,580 | $5,100 | $21,480 |
| 2019 | $2,066 | $21,120 | $5,100 | $16,020 |
| 2018 | $1,899 | $9,316 | $1,681 | $7,635 |
| 2017 | $1,792 | $8,791 | $2,058 | $6,733 |
| 2016 | $1,658 | $8,294 | $1,926 | $6,368 |
| 2015 | $1,000 | $8,294 | $2,373 | $5,921 |
| 2014 | $1,000 | $8,229 | $2,723 | $5,506 |
Source: Public Records
Map
Nearby Homes
- 203 Essex St
- 196 Shepherd Ave
- 206 Elton St
- 147 Essex St
- 324 Arlington Ave
- 120 Essex St
- 283 Shepherd Ave
- 225 Hale Ave Unit HSE
- 133 Highland Place
- 54 Elton St
- 120 Highland Place
- 168 Warwick St
- 117 Cleveland St
- 253 Ashford St
- 37 Montauk Ave
- 399 Linwood St
- 400 Linwood St
- 2880 Fulton St
- 126 Jerome St
- 171 Arlington Ave
- 261 Lindwood St
- 261 Linwood St
- 263 Linwood St
- 265 Linwood St
- 257 Linwood St
- 5 Folsom Place
- 255 Linwood St
- 255 Linwood St Unit Building
- 7 Folsom Place
- 251 Linwood St
- 249 Linwood St
- 9 Folsom Place
- 11 Folsom Place
- 247 Linwood St
- 262 Linwood St
- 258 Linwood St
- 264 Linwood St Unit L3
- 264 Linwood St Unit L2
- 264 Linwood St Unit L1
- 264 Linwood St Unit R1