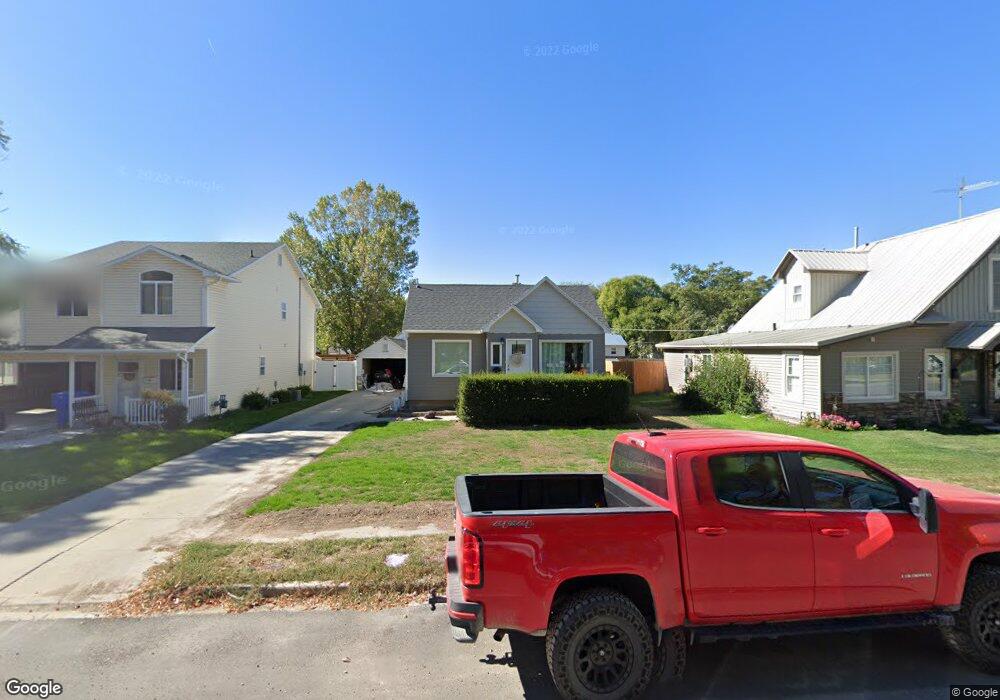
259 N Tremont St Tremonton, UT 84337
Estimated Value: $284,000 - $314,000
2
Beds
1
Bath
1,031
Sq Ft
$292/Sq Ft
Est. Value
About This Home
This home is located at 259 N Tremont St, Tremonton, UT 84337 and is currently estimated at $300,692, approximately $291 per square foot. 259 N Tremont St is a home located in Box Elder County with nearby schools including North Park School, Alice C. Harris Intermediate School, and Bear River Middle School.
Ownership History
Date
Name
Owned For
Owner Type
Purchase Details
Closed on
Jun 21, 2023
Sold by
Bess Emma and Bess Tyler
Bought by
Harrop Wyatt and Luthi Riki Vee
Current Estimated Value
Home Financials for this Owner
Home Financials are based on the most recent Mortgage that was taken out on this home.
Original Mortgage
$280,600
Outstanding Balance
$273,042
Interest Rate
6.35%
Mortgage Type
New Conventional
Estimated Equity
$27,650
Purchase Details
Closed on
Dec 7, 2020
Sold by
Herron Rentals Llc
Bought by
Bess Emma and Bess Tyler
Home Financials for this Owner
Home Financials are based on the most recent Mortgage that was taken out on this home.
Original Mortgage
$193,030
Interest Rate
2.8%
Mortgage Type
New Conventional
Purchase Details
Closed on
Mar 29, 2019
Sold by
Herron David and Herron Janette
Bought by
Herron Rentals Llc
Create a Home Valuation Report for This Property
The Home Valuation Report is an in-depth analysis detailing your home's value as well as a comparison with similar homes in the area
Home Values in the Area
Average Home Value in this Area
Purchase History
| Date | Buyer | Sale Price | Title Company |
|---|---|---|---|
| Harrop Wyatt | -- | Title Guarantee | |
| Bess Emma | -- | Title Guarantee Layton | |
| Herron Rentals Llc | -- | Northern Title Company |
Source: Public Records
Mortgage History
| Date | Status | Borrower | Loan Amount |
|---|---|---|---|
| Open | Harrop Wyatt | $280,600 | |
| Previous Owner | Bess Emma | $193,030 |
Source: Public Records
Tax History Compared to Growth
Tax History
| Year | Tax Paid | Tax Assessment Tax Assessment Total Assessment is a certain percentage of the fair market value that is determined by local assessors to be the total taxable value of land and additions on the property. | Land | Improvement |
|---|---|---|---|---|
| 2025 | $1,613 | $274,695 | $105,000 | $169,695 |
| 2024 | $1,613 | $273,603 | $105,000 | $168,603 |
| 2023 | $1,695 | $282,372 | $100,000 | $182,372 |
| 2022 | $1,371 | $130,167 | $16,500 | $113,667 |
| 2021 | $1,097 | $143,344 | $30,000 | $113,344 |
| 2020 | $948 | $143,344 | $30,000 | $113,344 |
| 2019 | $888 | $71,667 | $16,500 | $55,167 |
| 2018 | $550 | $41,257 | $13,750 | $27,507 |
| 2017 | $577 | $75,013 | $13,750 | $50,013 |
| 2016 | $572 | $39,947 | $13,750 | $26,197 |
| 2015 | $533 | $37,566 | $13,750 | $23,816 |
| 2014 | $533 | $36,431 | $13,750 | $22,681 |
| 2013 | -- | $36,432 | $13,338 | $23,094 |
Source: Public Records
Map
Nearby Homes
- 249 N Tremont St
- 269 N Tremont St
- 237 N Tremont St
- 227 N Tremont St
- 227 N Tremont St
- 307 N Tremont St
- 39 W 300 N
- 88 W 300 N Unit A
- 250 N 100 W
- 205 N Tremont St
- 274 N 100 W
- 321 N Tremont St
- 228 N 100 W
- 329 N Tremont St
- 322 N Tremont St
- 306 N Tremont St
- 245 N 400 W
- 52 W 200 N
- 320 N 100 W
- 341 N Tremont St