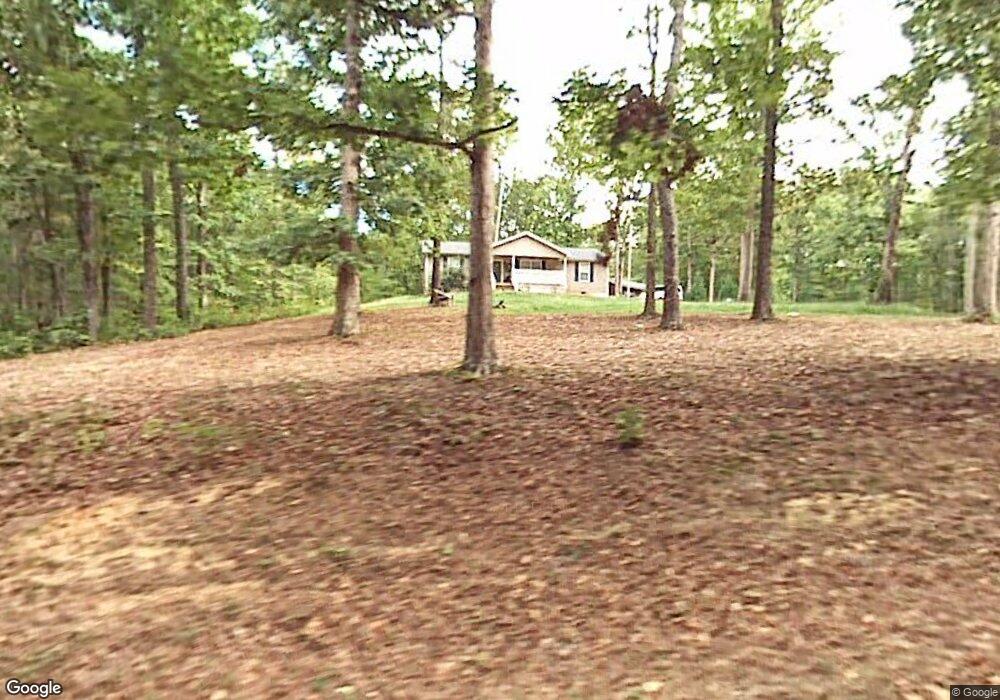
259 Ridge Rd La Fayette, GA 30728
Estimated Value: $236,000 - $343,000
--
Bed
2
Baths
1,344
Sq Ft
$213/Sq Ft
Est. Value
About This Home
This home is located at 259 Ridge Rd, La Fayette, GA 30728 and is currently estimated at $286,588, approximately $213 per square foot. 259 Ridge Rd is a home located in Walker County with nearby schools including Gilbert Elementary School, Lafayette Middle School, and Lafayette High School.
Ownership History
Date
Name
Owned For
Owner Type
Purchase Details
Closed on
Aug 10, 2006
Sold by
Snider John Thomas
Bought by
Snider John Thomas
Current Estimated Value
Home Financials for this Owner
Home Financials are based on the most recent Mortgage that was taken out on this home.
Original Mortgage
$101,250
Outstanding Balance
$60,491
Interest Rate
6.67%
Mortgage Type
New Conventional
Estimated Equity
$226,097
Purchase Details
Closed on
Oct 22, 2002
Sold by
Kellett Ronald L and Kellett Elaine
Bought by
Snider John Thomas
Purchase Details
Closed on
Sep 4, 1998
Sold by
Kellett Elaine
Bought by
Snider Tommy S and Snider Rose E
Purchase Details
Closed on
Dec 20, 1996
Sold by
Huey George W and Tucker Joel M
Bought by
Kellett Elaine
Purchase Details
Closed on
Mar 1, 1988
Sold by
Serkowski Alex and Serkowski Scyleda
Bought by
Huey George W and Tucker Joel M
Purchase Details
Closed on
May 21, 1971
Bought by
Serkowski Alex and Serkowski Scyleda
Create a Home Valuation Report for This Property
The Home Valuation Report is an in-depth analysis detailing your home's value as well as a comparison with similar homes in the area
Home Values in the Area
Average Home Value in this Area
Purchase History
| Date | Buyer | Sale Price | Title Company |
|---|---|---|---|
| Snider John Thomas | -- | -- | |
| Snider John Thomas | -- | -- | |
| Snider Tommy S | $14,000 | -- | |
| Kellett Ronald L | $7,200 | -- | |
| Kellett Elaine | -- | -- | |
| Huey George W | $20,000 | -- | |
| Serkowski Alex | -- | -- |
Source: Public Records
Mortgage History
| Date | Status | Borrower | Loan Amount |
|---|---|---|---|
| Open | Snider John Thomas | $101,250 |
Source: Public Records
Tax History Compared to Growth
Tax History
| Year | Tax Paid | Tax Assessment Tax Assessment Total Assessment is a certain percentage of the fair market value that is determined by local assessors to be the total taxable value of land and additions on the property. | Land | Improvement |
|---|---|---|---|---|
| 2024 | $2,281 | $106,013 | $29,037 | $76,976 |
| 2023 | $1,822 | $81,851 | $23,045 | $58,806 |
| 2022 | $1,512 | $61,902 | $11,747 | $50,155 |
| 2021 | $1,215 | $44,568 | $11,747 | $32,821 |
| 2020 | $1,060 | $37,232 | $11,747 | $25,485 |
| 2019 | $1,079 | $37,232 | $11,747 | $25,485 |
| 2018 | $985 | $37,232 | $11,747 | $25,485 |
| 2017 | $1,182 | $37,232 | $11,747 | $25,485 |
| 2016 | $992 | $37,232 | $11,747 | $25,485 |
| 2015 | $1,119 | $39,976 | $14,164 | $25,812 |
| 2014 | $1,023 | $39,976 | $14,164 | $25,812 |
| 2013 | -- | $39,975 | $14,164 | $25,811 |
Source: Public Records
Map
Nearby Homes
- 62 + - Acres On Chamberlain Rd
- 0 Chamberlain Rd Unit LotWP001
- 334 S Oakland Dr
- 24605 Highway 193
- 300 Bronco Rd
- 1152 Magnolia St
- 1314 W Main St
- 1103 Sisemore St
- 1002 Colerain St
- 908 Gilbert Ln
- 1125 S Chattanooga St
- 0 Indiana St Unit 28 10583802
- 0 W Main St Unit 1518094
- 206 Glenn St
- 802 Mclemore St
- 800 Mclemore St
- 707 Gilbert Ln
- 712 Mclemore St
- 308 Pledger Pkwy
- 705 Mclemore St
- 287 Ridge Rd
- 22 Ridge Rd
- N Ridge Rd
- N Ridge Rd Unit Tract 10
- 217 Ridge Rd
- 403 Ridge Rd
- 853 Chamberlain Rd
- 405 Ridge Rd
- 405 Ridge Rd
- 817 Chamberlain Rd
- 789 Chamberlain Rd
- 943 Chamberlain Rd
- 751 Chamberlain Rd
- 985 Chamberlain Rd
- 163 Ridge Rd
- 169 Ridge Rd
- 533 Ridge Rd
- 695 Chamberlain Rd
- 1043 Chamberlain Rd
- 1035 Chamberlain Rd