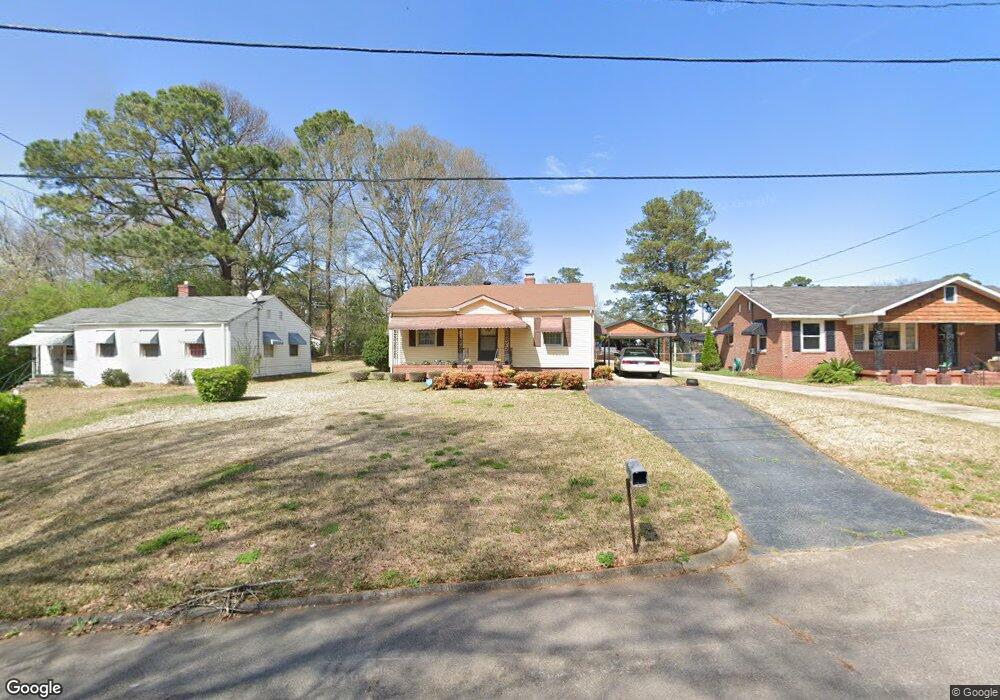
259 Rutland Cir Lagrange, GA 30241
Estimated Value: $102,000 - $144,000
2
Beds
1
Bath
800
Sq Ft
$146/Sq Ft
Est. Value
About This Home
This home is located at 259 Rutland Cir, Lagrange, GA 30241 and is currently estimated at $116,728, approximately $145 per square foot. 259 Rutland Cir is a home located in Troup County with nearby schools including Franklin Forest Elementary School, Hollis Hand Elementary School, and Ethel W. Kight Elementary School.
Ownership History
Date
Name
Owned For
Owner Type
Purchase Details
Closed on
Nov 4, 1997
Sold by
Edgar Barnell Freeman Sr By Ex
Bought by
Freeman Carol Oneal
Current Estimated Value
Purchase Details
Closed on
Jul 3, 1984
Sold by
Hester Terrell E and Hester Leslie L
Bought by
Edgar Barnell Freeman Sr By Ex
Purchase Details
Closed on
Oct 9, 1980
Sold by
Knopp Anthony E and Knopp Sheri C
Bought by
Hester Terrell E and Hester Leslie L
Purchase Details
Closed on
Jul 12, 1978
Sold by
Gilbert Anthony E and Gilbert Sheri C
Bought by
Knopp Anthony E and Knopp Sheri C
Purchase Details
Closed on
Aug 30, 1977
Sold by
Wilkinson Janice Marie
Bought by
Gilbert Anthony E and Gilbert Sheri C
Purchase Details
Closed on
Jul 17, 1975
Sold by
Wilkinson Thomas H
Bought by
Wilkinson Janice Marie
Purchase Details
Closed on
Jan 1, 1971
Sold by
Langley James A and Langley Eurla
Bought by
Wilkinson Thomas H
Purchase Details
Closed on
Apr 1, 1965
Sold by
Robinson Bobby and Margie Ann
Bought by
Langley James A and Langley Eurla
Create a Home Valuation Report for This Property
The Home Valuation Report is an in-depth analysis detailing your home's value as well as a comparison with similar homes in the area
Home Values in the Area
Average Home Value in this Area
Purchase History
| Date | Buyer | Sale Price | Title Company |
|---|---|---|---|
| Freeman Carol Oneal | -- | -- | |
| Edgar Barnell Freeman Sr By Ex | $15,500 | -- | |
| Hester Terrell E | $4,500 | -- | |
| Knopp Anthony E | $19,000 | -- | |
| Gilbert Anthony E | $1,800 | -- | |
| Wilkinson Janice Marie | -- | -- | |
| Wilkinson Thomas H | $10,500 | -- | |
| Langley James A | -- | -- |
Source: Public Records
Tax History Compared to Growth
Tax History
| Year | Tax Paid | Tax Assessment Tax Assessment Total Assessment is a certain percentage of the fair market value that is determined by local assessors to be the total taxable value of land and additions on the property. | Land | Improvement |
|---|---|---|---|---|
| 2024 | $215 | $31,608 | $8,000 | $23,608 |
| 2023 | $44 | $32,076 | $6,880 | $25,196 |
| 2022 | $221 | $30,836 | $6,880 | $23,956 |
| 2021 | $168 | $24,780 | $6,880 | $17,900 |
| 2020 | $447 | $24,780 | $6,880 | $17,900 |
| 2019 | $239 | $17,880 | $5,724 | $12,156 |
| 2018 | $239 | $17,880 | $5,724 | $12,156 |
| 2017 | $239 | $17,880 | $5,724 | $12,156 |
| 2016 | $236 | $17,772 | $5,724 | $12,048 |
| 2015 | $203 | $16,670 | $5,724 | $10,946 |
| 2014 | $200 | $16,577 | $5,724 | $10,853 |
| 2013 | -- | $17,206 | $5,724 | $11,482 |
Source: Public Records
Map
Nearby Homes
- 210 Hearthstone Dr
- 130 Clara Jean Ct
- 121 Ct
- 305 Lenox Cir
- 226 Lenox Cir
- 105 Lenox Cir
- 101 Lenox Cir
- 618 S Harlem Cir
- 5 Curran Ave
- 616 S Harlem Cir
- 0 N Barnard Ave
- 706 N Harlem Cir
- 608 S Harlem Cir
- 606 S Harlem Cir
- 600 S Harlem Cir
- 131 Foch St
- 121 de Groat St
- 906 Georgia Ave
- 902 Georgia Ave
- 109 Dogwood Dr
- 257 Rutland Cir
- 261 Rutland Cir
- 255 Rutland Cir
- 263 Rutland Cir
- 263 Rutland Cir Unit 14
- 109 Bonaventure Dr
- 107 Bonaventure Dr
- 234 Rutland Cir
- 111 Bonaventure Dr
- 253 Rutland Cir
- 265 Rutland Cir
- 267 Rutland Cir
- 113 Bonaventure Dr
- 232 Rutland Cir
- 103 Bonaventure Dr
- 236 Rutland Cir
- 269 Rutland Cir
- 115 Bonaventure Dr
- 230 Rutland Cir Unit 6
- 230 Rutland Cir