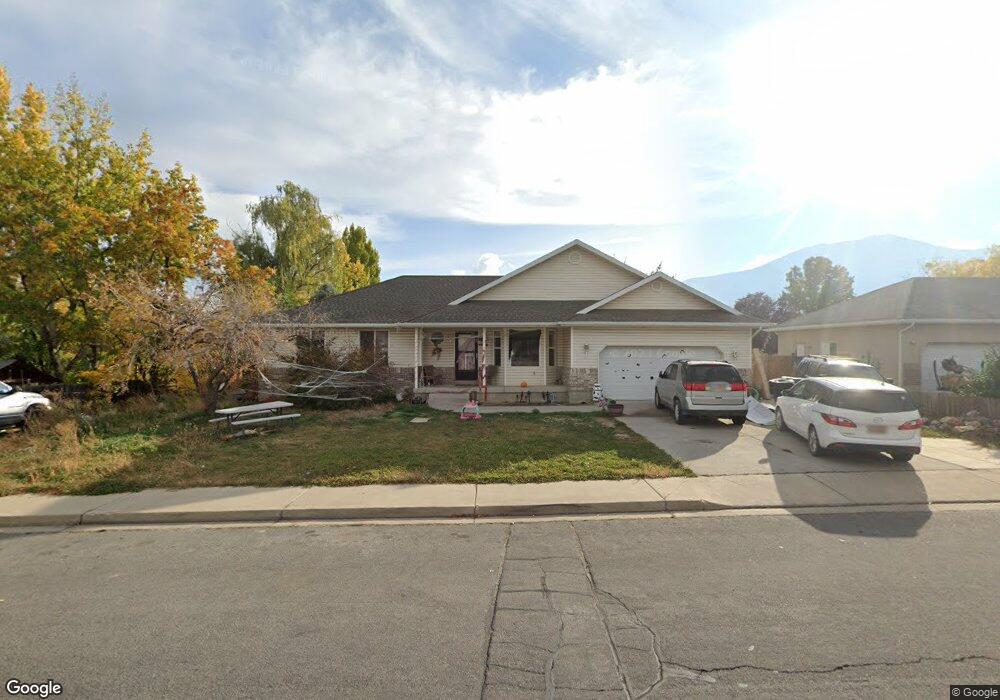
259 S 1100 E Payson, UT 84651
Estimated Value: $538,000 - $609,000
3
Beds
2
Baths
3,162
Sq Ft
$183/Sq Ft
Est. Value
About This Home
This home is located at 259 S 1100 E, Payson, UT 84651 and is currently estimated at $577,118, approximately $182 per square foot. 259 S 1100 E is a home located in Utah County with nearby schools including Barnett Elementary School, Salem Junior High School, and Valley View Middle School.
Ownership History
Date
Name
Owned For
Owner Type
Purchase Details
Closed on
Sep 27, 2022
Sold by
Unknown
Bought by
Wilkins Family Revocable Trust
Current Estimated Value
Purchase Details
Closed on
Jun 22, 2017
Sold by
Wilkins Dixie L and The Wilkins Family Revocable T
Bought by
Wilkins Dixie L
Purchase Details
Closed on
Dec 27, 2012
Sold by
Allman Dixie Lee
Bought by
Allman Dixie Lee and Allman Kari Lynn
Purchase Details
Closed on
Aug 16, 2012
Sold by
Houle Delores Joan and Houle Fammily Revocable Trust
Bought by
Allaman Dixie Lee
Home Financials for this Owner
Home Financials are based on the most recent Mortgage that was taken out on this home.
Original Mortgage
$156,560
Interest Rate
3.49%
Mortgage Type
New Conventional
Purchase Details
Closed on
Jun 18, 2004
Sold by
Houle Richard E and Houle Delores Joan
Bought by
Houle Richard Eugene and Houle Delores Joan
Purchase Details
Closed on
Aug 18, 1998
Sold by
Taylor Turner Properties L C
Bought by
Houle Richard E and Houle Delores Joan
Create a Home Valuation Report for This Property
The Home Valuation Report is an in-depth analysis detailing your home's value as well as a comparison with similar homes in the area
Home Values in the Area
Average Home Value in this Area
Purchase History
| Date | Buyer | Sale Price | Title Company |
|---|---|---|---|
| Wilkins Family Revocable Trust | -- | -- | |
| Wilkins Dixie L | -- | None Available | |
| Allman Dixie Lee | -- | None Available | |
| Allaman Dixie Lee | -- | Inwest Title Service Inc | |
| Houle Richard Eugene | -- | -- | |
| Houle Richard E | -- | First American Title |
Source: Public Records
Mortgage History
| Date | Status | Borrower | Loan Amount |
|---|---|---|---|
| Previous Owner | Allaman Dixie Lee | $156,560 |
Source: Public Records
Tax History
| Year | Tax Paid | Tax Assessment Tax Assessment Total Assessment is a certain percentage of the fair market value that is determined by local assessors to be the total taxable value of land and additions on the property. | Land | Improvement |
|---|---|---|---|---|
| 2025 | $2,851 | $307,780 | -- | -- |
| 2024 | $2,851 | $290,180 | $0 | $0 |
| 2023 | $2,880 | $293,865 | $0 | $0 |
| 2022 | $2,792 | $280,280 | $0 | $0 |
| 2021 | $2,350 | $378,300 | $128,100 | $250,200 |
| 2020 | $2,195 | $345,700 | $111,400 | $234,300 |
| 2019 | $2,022 | $326,500 | $92,200 | $234,300 |
| 2018 | $1,874 | $291,700 | $84,500 | $207,200 |
| 2017 | $1,910 | $159,885 | $0 | $0 |
| 2016 | $1,837 | $152,735 | $0 | $0 |
| 2015 | $1,632 | $134,750 | $0 | $0 |
| 2014 | $1,432 | $119,130 | $0 | $0 |
Source: Public Records
Map
Nearby Homes
- 981 E 100 S
- 977 E 100 S
- 1327 E 320 S
- 412 S Goosenest Dr
- 426 S Goosenest Dr
- 1298 1670 N
- 1299 E 1670 N Unit 812
- 1299 E 1670 N
- 1058 E 100 N
- 753 N Emery Ln Unit 57
- 678 N Mountain View Dr
- 552 E Longview Dr Unit 29
- 348 E Dr E Unit 26
- 5620 W 8800 S Unit 2
- 643 E Longview Dr Unit 8
- 337 W 100 S
- 844 N Emery Ln Unit 59
- 942 W Wilcock Cove
- 4100 W 12400 S
- 523 1045 S 1700 S Unit 523
Your Personal Tour Guide
Ask me questions while you tour the home.