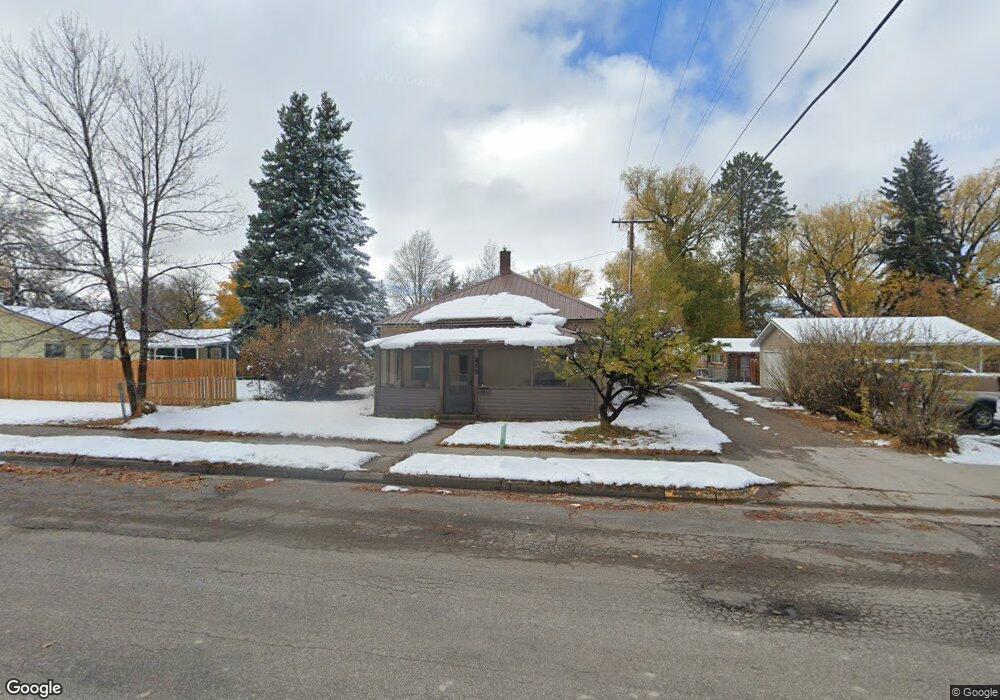
259 S 3rd St Lander, WY 82520
Estimated Value: $232,668 - $337,000
2
Beds
1
Bath
1,194
Sq Ft
$248/Sq Ft
Est. Value
About This Home
This home is located at 259 S 3rd St, Lander, WY 82520 and is currently estimated at $296,667, approximately $248 per square foot. 259 S 3rd St is a home located in Fremont County with nearby schools including Lander Valley High School and Lander Christian Academy.
Ownership History
Date
Name
Owned For
Owner Type
Purchase Details
Closed on
Aug 15, 2018
Sold by
Piazzisi Jack Liborio and Osten Kathy Von
Bought by
Piazzisi Marco Von Osten
Current Estimated Value
Purchase Details
Closed on
Apr 12, 2018
Sold by
Plazzisi Jack L and Osten Katherine A Von
Bought by
Plazzisi Marco Von Osten
Purchase Details
Closed on
Oct 12, 2017
Sold by
Suniga Marcia
Bought by
Osten Piazzisi Marco L Von
Home Financials for this Owner
Home Financials are based on the most recent Mortgage that was taken out on this home.
Original Mortgage
$155,555
Outstanding Balance
$129,932
Interest Rate
3.82%
Mortgage Type
New Conventional
Estimated Equity
$166,735
Purchase Details
Closed on
Apr 7, 2006
Sold by
Meisinger Richard N and Meisinger Kevin R
Bought by
Suniga Marcia
Home Financials for this Owner
Home Financials are based on the most recent Mortgage that was taken out on this home.
Original Mortgage
$81,000
Interest Rate
6.22%
Mortgage Type
Purchase Money Mortgage
Create a Home Valuation Report for This Property
The Home Valuation Report is an in-depth analysis detailing your home's value as well as a comparison with similar homes in the area
Home Values in the Area
Average Home Value in this Area
Purchase History
| Date | Buyer | Sale Price | Title Company |
|---|---|---|---|
| Piazzisi Marco Von Osten | -- | None Available | |
| Plazzisi Marco Von Osten | -- | None Available | |
| Osten Piazzisi Marco L Von | -- | None Available | |
| Suniga Marcia | -- | None Available |
Source: Public Records
Mortgage History
| Date | Status | Borrower | Loan Amount |
|---|---|---|---|
| Open | Osten Piazzisi Marco L Von | $155,555 | |
| Previous Owner | Suniga Marcia | $81,000 |
Source: Public Records
Tax History
| Year | Tax Paid | Tax Assessment Tax Assessment Total Assessment is a certain percentage of the fair market value that is determined by local assessors to be the total taxable value of land and additions on the property. | Land | Improvement |
|---|---|---|---|---|
| 2025 | $1,495 | $15,993 | $3,949 | $12,044 |
| 2024 | $1,495 | $19,372 | $5,265 | $14,107 |
| 2023 | $1,401 | $18,300 | $4,725 | $13,575 |
| 2022 | $1,210 | $16,151 | $4,725 | $11,426 |
| 2021 | $1,093 | $14,117 | $4,480 | $9,637 |
| 2020 | $1,058 | $13,692 | $4,480 | $9,212 |
| 2019 | $1,052 | $13,404 | $4,480 | $8,924 |
| 2018 | $1,031 | $12,989 | $4,480 | $8,509 |
| 2017 | $1,014 | $12,750 | $4,480 | $8,270 |
| 2016 | $1,077 | $13,558 | $4,480 | $9,078 |
| 2015 | $1,051 | $13,373 | $4,480 | $8,893 |
| 2014 | $978 | $12,472 | $4,480 | $7,992 |
Source: Public Records
Map
Nearby Homes
- 291 S 3rd St
- 280 S 3rd St
- 319 Garfield St
- 328 Sweetwater St
- 290 S 3rd St
- 274 Sweetwater St
- 269 Garfield St
- 336 Sweetwater St
- 262 Sweetwater St
- 312 S 3rd St
- 261 Garfield St
- 242 Sweetwater St
- 242 Sweetwater St
- 340 Sweetwater St
- 340 Sweetwater St Unit South 3rd Street
- 340 Sweetwater St Unit South 3rd
- 255 Garfield St
- 367 Garfield St
- 350 Sweetwater St
- 345 S 3rd St
Your Personal Tour Guide
Ask me questions while you tour the home.