Estimated Value: $389,000 - $431,000
2
Beds
2
Baths
1,587
Sq Ft
$259/Sq Ft
Est. Value
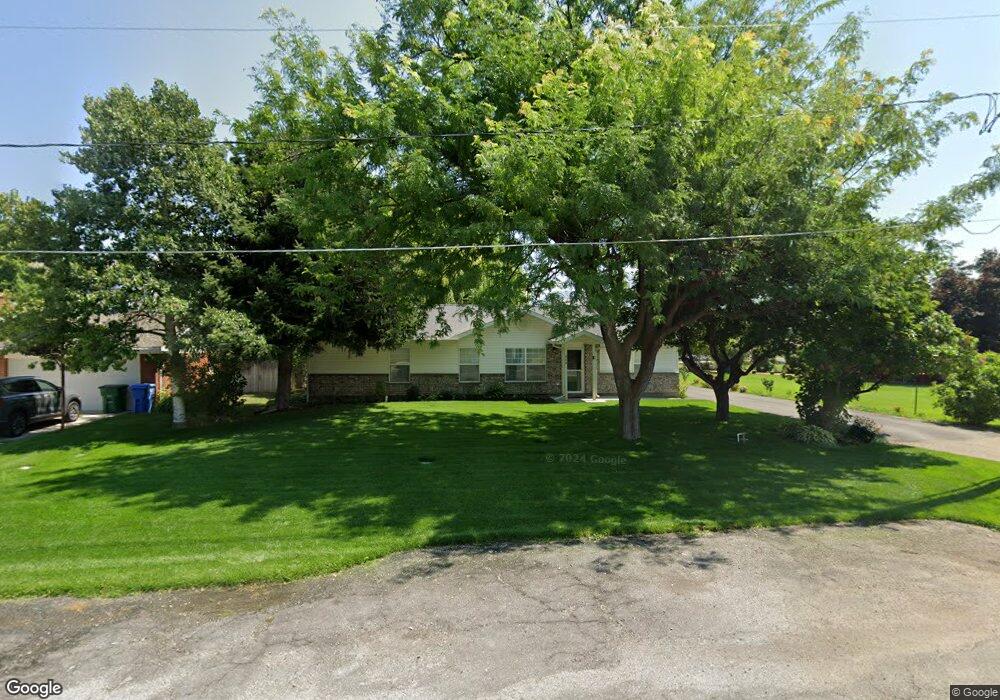
About This Home
This home is located at 259 S 500 E, Hyrum, UT 84319 and is currently estimated at $410,269, approximately $258 per square foot. 259 S 500 E is a home located in Cache County with nearby schools including Millville School, South Cache Middle School, and Mountain Crest High School.
Ownership History
Date
Name
Owned For
Owner Type
Purchase Details
Closed on
Jun 11, 2019
Sold by
Henrichsen Hopkins Lyman Shane and Henrichsen Hopkins Diana Rose
Bought by
Hunter Timothy J and Hunter Rhonda K
Current Estimated Value
Home Financials for this Owner
Home Financials are based on the most recent Mortgage that was taken out on this home.
Original Mortgage
$232,215
Outstanding Balance
$205,859
Interest Rate
4.62%
Mortgage Type
FHA
Estimated Equity
$204,410
Purchase Details
Closed on
Jul 7, 2017
Sold by
Hopkins Molly Anne
Bought by
Hopkins Lyman Shane and Henrichson Hopkins Diana Rose
Purchase Details
Closed on
Jun 30, 2017
Sold by
Hopkins Clifford T and Hopkins Molly Anne
Bought by
Hopkins Molly Anne
Purchase Details
Closed on
Jun 11, 2012
Sold by
Nelson Doris B
Bought by
Hopkins Clifford T and Hopkins Mollyanne
Create a Home Valuation Report for This Property
The Home Valuation Report is an in-depth analysis detailing your home's value as well as a comparison with similar homes in the area
Home Values in the Area
Average Home Value in this Area
Purchase History
| Date | Buyer | Sale Price | Title Company |
|---|---|---|---|
| Hunter Timothy J | -- | Hickman Land Title Logan | |
| Hopkins Lyman Shane | -- | Hickman Land Title Company | |
| Hopkins Molly Anne | -- | Hickman Land Title Company | |
| Hopkins Clifford T | -- | American Secure Title Logan |
Source: Public Records
Mortgage History
| Date | Status | Borrower | Loan Amount |
|---|---|---|---|
| Open | Hunter Timothy J | $232,215 |
Source: Public Records
Tax History
| Year | Tax Paid | Tax Assessment Tax Assessment Total Assessment is a certain percentage of the fair market value that is determined by local assessors to be the total taxable value of land and additions on the property. | Land | Improvement |
|---|---|---|---|---|
| 2025 | $1,381 | $198,255 | $0 | $0 |
| 2024 | $1,476 | $197,885 | $0 | $0 |
| 2023 | $1,399 | $179,345 | $0 | $0 |
| 2022 | $1,460 | $179,350 | $0 | $0 |
| 2021 | $1,457 | $271,420 | $65,050 | $206,370 |
| 2020 | $1,184 | $207,653 | $65,050 | $142,603 |
| 2019 | $1,101 | $181,383 | $38,780 | $142,603 |
| 2018 | $1,027 | $163,200 | $38,780 | $124,420 |
| 2017 | $1,016 | $85,140 | $0 | $0 |
| 2016 | $1,039 | $85,140 | $0 | $0 |
| 2015 | $968 | $79,130 | $0 | $0 |
| 2014 | $945 | $78,965 | $0 | $0 |
| 2013 | -- | $78,965 | $0 | $0 |
Source: Public Records
Map
Nearby Homes
Your Personal Tour Guide
Ask me questions while you tour the home.