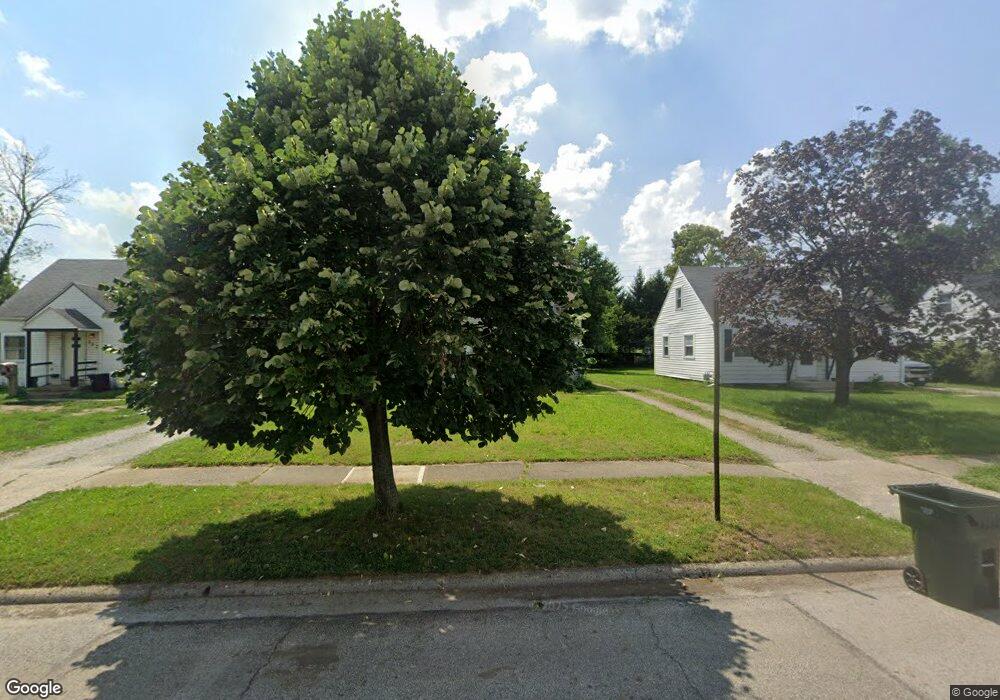
259 S Ashburton Rd Columbus, OH 43213
Eastmoor NeighborhoodEstimated Value: $129,000 - $197,204
4
Beds
1
Bath
1,220
Sq Ft
$131/Sq Ft
Est. Value
About This Home
This home is located at 259 S Ashburton Rd, Columbus, OH 43213 and is currently estimated at $160,301, approximately $131 per square foot. 259 S Ashburton Rd is a home located in Franklin County with nearby schools including Fairmoor Elementary School, Johnson Park Middle School, and Walnut Ridge High School.
Ownership History
Date
Name
Owned For
Owner Type
Purchase Details
Closed on
Aug 8, 2024
Sold by
Vb One Llc
Bought by
Vb Nine Llc
Current Estimated Value
Home Financials for this Owner
Home Financials are based on the most recent Mortgage that was taken out on this home.
Original Mortgage
$171,636,696
Outstanding Balance
$139,207,794
Interest Rate
6.78%
Mortgage Type
New Conventional
Estimated Equity
-$139,047,493
Purchase Details
Closed on
Nov 18, 2021
Sold by
Jennings Mary E
Bought by
Vb One Llc
Purchase Details
Closed on
Sep 27, 1994
Sold by
Bryant Bruce C
Bought by
Jennings Keith L and Jennings Cynthia M
Home Financials for this Owner
Home Financials are based on the most recent Mortgage that was taken out on this home.
Original Mortgage
$57,927
Interest Rate
8.62%
Mortgage Type
FHA
Purchase Details
Closed on
Sep 1, 1986
Create a Home Valuation Report for This Property
The Home Valuation Report is an in-depth analysis detailing your home's value as well as a comparison with similar homes in the area
Home Values in the Area
Average Home Value in this Area
Purchase History
| Date | Buyer | Sale Price | Title Company |
|---|---|---|---|
| Vb Nine Llc | $12,041,000 | Os National | |
| Vb Nine Llc | $12,041,000 | Os National | |
| Vb One Llc | $100,000 | Total Title Services Llc | |
| Jennings Keith L | $58,000 | -- | |
| -- | $47,500 | -- |
Source: Public Records
Mortgage History
| Date | Status | Borrower | Loan Amount |
|---|---|---|---|
| Open | Vb Nine Llc | $171,636,696 | |
| Closed | Vb Nine Llc | $171,636,696 | |
| Previous Owner | Jennings Keith L | $57,927 |
Source: Public Records
Tax History Compared to Growth
Tax History
| Year | Tax Paid | Tax Assessment Tax Assessment Total Assessment is a certain percentage of the fair market value that is determined by local assessors to be the total taxable value of land and additions on the property. | Land | Improvement |
|---|---|---|---|---|
| 2024 | $2,589 | $56,490 | $12,390 | $44,100 |
| 2023 | $3,133 | $56,490 | $12,390 | $44,100 |
| 2022 | $2,245 | $42,250 | $7,420 | $34,830 |
| 2021 | $2,559 | $42,250 | $7,420 | $34,830 |
| 2020 | $2,301 | $42,250 | $7,420 | $34,830 |
| 2019 | $2,186 | $35,150 | $6,200 | $28,950 |
| 2018 | $1,921 | $35,150 | $6,200 | $28,950 |
| 2017 | $2,185 | $35,150 | $6,200 | $28,950 |
| 2016 | $1,824 | $26,850 | $5,530 | $21,320 |
| 2015 | $1,661 | $26,850 | $5,530 | $21,320 |
| 2014 | $1,665 | $26,850 | $5,530 | $21,320 |
| 2013 | $864 | $28,245 | $5,810 | $22,435 |
Source: Public Records
Map
Nearby Homes
- 277 S James Rd
- 247 S James Rd
- 297 S James Rd
- 239 S Kellner Rd
- 430 S James Rd
- 184 S Hampton Rd
- 201 S Weyant Ave
- 3160 Fair Ave
- 178 S Weyant Ave
- 523 S Napoleon Ave
- 560 S Kellner Rd
- 565 S Kellner Rd
- 50 S Chesterfield Rd
- 635 Elizabeth Ave
- 59 N Everett Ave
- 283 Maplewood Ave
- 73 N Everett Ave
- 142 S Gould Rd
- 73 N Hampton Rd
- 646 S Weyant Ave
- 253 S Ashburton Rd
- 267 S Ashburton Rd
- 249 S Ashburton Rd
- 273 S Ashburton Rd
- 252 S James Rd
- 239 S Ashburton Rd
- 260 S James Rd
- 279 S Ashburton Rd
- 244 S James Rd
- 268 S James Rd
- 231 S Ashburton Rd
- 278 S James Rd
- 278 S James Rd
- 226 S James Rd
- 225 S Ashburton Rd
- 236 S James Rd
- 226 S James Rd
- 284 S James Rd
- 217 S Ashburton Rd
- 292 James Rd