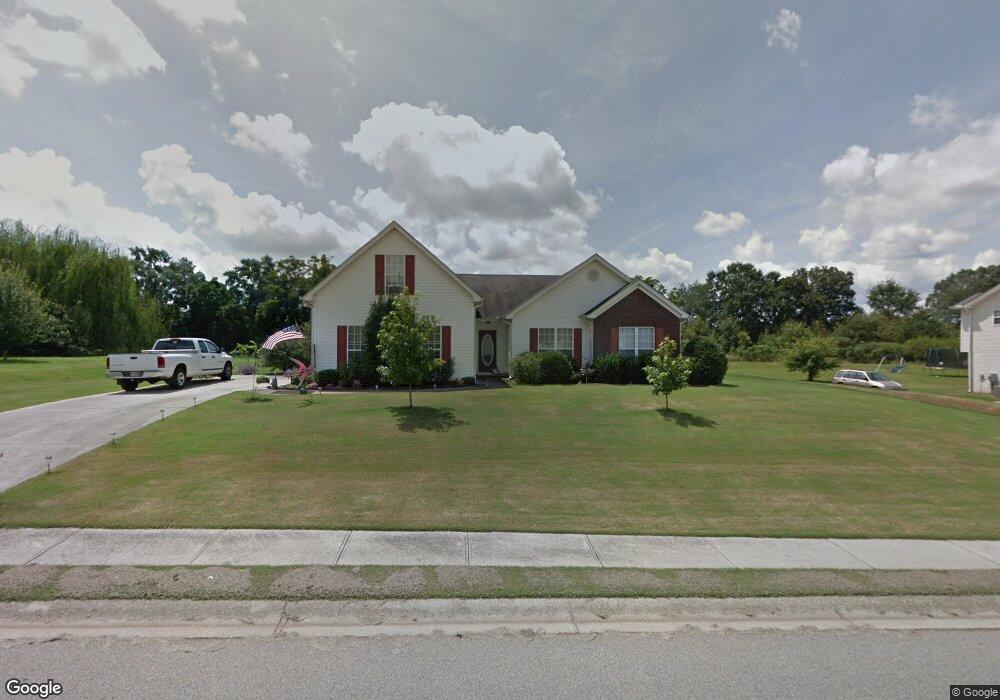
259 Spratlin Dr Jefferson, GA 30549
Estimated Value: $330,858 - $357,000
--
Bed
2
Baths
1,678
Sq Ft
$205/Sq Ft
Est. Value
About This Home
This home is located at 259 Spratlin Dr, Jefferson, GA 30549 and is currently estimated at $344,715, approximately $205 per square foot. 259 Spratlin Dr is a home located in Jackson County with nearby schools including Jefferson Elementary School, Jefferson Academy, and Jefferson Middle School.
Ownership History
Date
Name
Owned For
Owner Type
Purchase Details
Closed on
Dec 18, 2021
Sold by
Hollan Lee
Bought by
Hollan Sharon L and Bailey Pamela
Current Estimated Value
Home Financials for this Owner
Home Financials are based on the most recent Mortgage that was taken out on this home.
Original Mortgage
$167,917
Interest Rate
3.55%
Mortgage Type
FHA
Purchase Details
Closed on
Jul 11, 2007
Sold by
Not Provided
Bought by
Hollan Sharon L and Hollan Lee
Home Financials for this Owner
Home Financials are based on the most recent Mortgage that was taken out on this home.
Original Mortgage
$140,600
Interest Rate
6.71%
Mortgage Type
New Conventional
Purchase Details
Closed on
Oct 28, 2003
Sold by
Sperber Ernest
Bought by
Sperber Ernest
Purchase Details
Closed on
Mar 12, 2003
Sold by
Spratlin Estates Llc
Bought by
Mclintack Construction Corp
Create a Home Valuation Report for This Property
The Home Valuation Report is an in-depth analysis detailing your home's value as well as a comparison with similar homes in the area
Home Values in the Area
Average Home Value in this Area
Purchase History
| Date | Buyer | Sale Price | Title Company |
|---|---|---|---|
| Hollan Sharon L | -- | -- | |
| Hollan Sharon L | -- | -- | |
| Hollan Sharon L | $148,000 | -- | |
| Sperber Ernest | -- | -- | |
| Sperber Ernest | $131,500 | -- | |
| Mclintack Construction Corp | $33,000 | -- |
Source: Public Records
Mortgage History
| Date | Status | Borrower | Loan Amount |
|---|---|---|---|
| Previous Owner | Hollan Sharon L | $167,917 | |
| Previous Owner | Hollan Sharon L | $140,600 |
Source: Public Records
Tax History Compared to Growth
Tax History
| Year | Tax Paid | Tax Assessment Tax Assessment Total Assessment is a certain percentage of the fair market value that is determined by local assessors to be the total taxable value of land and additions on the property. | Land | Improvement |
|---|---|---|---|---|
| 2024 | $1,665 | $89,240 | $17,160 | $72,080 |
| 2023 | $1,665 | $81,600 | $17,160 | $64,440 |
| 2022 | $1,388 | $69,640 | $17,160 | $52,480 |
| 2021 | $1,250 | $64,480 | $12,000 | $52,480 |
| 2020 | $1,043 | $55,480 | $12,000 | $43,480 |
| 2019 | $1,069 | $55,480 | $12,000 | $43,480 |
| 2018 | $1,008 | $53,400 | $12,000 | $41,400 |
| 2017 | $950 | $51,354 | $12,000 | $39,354 |
| 2016 | $902 | $49,754 | $10,400 | $39,354 |
| 2015 | $813 | $45,354 | $6,000 | $39,354 |
| 2014 | $671 | $38,340 | $6,000 | $32,340 |
| 2013 | -- | $38,339 | $6,000 | $32,339 |
Source: Public Records
Map
Nearby Homes
- 41 Melivy Ct
- 17 Castleview Ct
- 176 Village Dr
- 1841 Jett Roberts Rd
- 1817 Jett Roberts Rd
- 1681 Jett Roberts Rd
- 345 Hickory Hills Dr
- 273 Hickory Hills Dr
- 430 Katherine Dr
- 445 Katherine Dr
- 750 Jett Roberts Rd
- 194 Georgia 82 N
- 955 Georgia 82 N
- Tract 1 Georgia 82 N
- 1945 Georgia 82 N
- 567 Storey Ln
- 525 Storey Ln
- 545 Jefferson Blvd
- 277 Spratlin Dr
- 231 Spratlin Dr
- 270 Spratlin Dr
- 270 Spratlin Dr Unit 38
- 211 Spratlin Dr
- 230 Spratlin Dr
- 305 Spratlin Dr
- 305 Spratlin Dr Unit 13
- 0 Spratlin Dr Unit 8627794
- 0 Spratlin Dr Unit 8600397
- 0 Spratlin Dr Unit 7312646
- 0 Spratlin Dr Unit 3081704
- 0 Spratlin Dr Unit 3233897
- 0 Spratlin Dr Unit 3261943
- 0 Spratlin Dr Unit 7081711
- 0 Spratlin Dr Unit 7165197
- 0 Spratlin Dr Unit 7183126
- 0 Spratlin Dr Unit 7273747
- 0 Spratlin Dr Unit 7295645
- 0 Spratlin Dr Unit 7572208