Estimated Value: $355,000 - $453,000
4
Beds
3
Baths
1,715
Sq Ft
$245/Sq Ft
Est. Value
About This Home
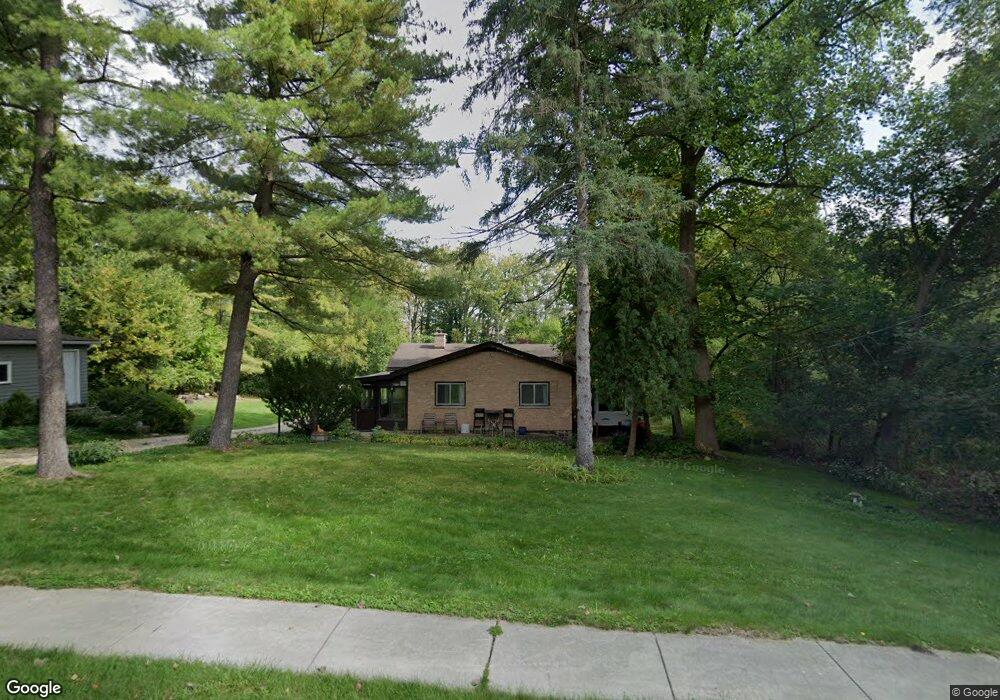
This home is located at 259 Spring St, Cary, IL 60013 and is currently estimated at $420,397, approximately $245 per square foot. 259 Spring St is a home located in McHenry County with nearby schools including Briargate Elementary School, Cary Jr High School, and Cary-Grove High School.
Ownership History
Date
Name
Owned For
Owner Type
Purchase Details
Closed on
Aug 20, 2009
Sold by
Ecklund Keith A
Bought by
Prybil Donna M
Current Estimated Value
Home Financials for this Owner
Home Financials are based on the most recent Mortgage that was taken out on this home.
Original Mortgage
$132,000
Outstanding Balance
$86,415
Interest Rate
5.29%
Mortgage Type
New Conventional
Estimated Equity
$333,982
Purchase Details
Closed on
Dec 29, 2005
Sold by
Dankert Dorothy J
Bought by
Dankert Dorothy J and Eckland Keith A
Purchase Details
Closed on
Jun 14, 2002
Sold by
Napier Ella
Bought by
Dankert Richard L and Dankert Dorothy J
Home Financials for this Owner
Home Financials are based on the most recent Mortgage that was taken out on this home.
Original Mortgage
$189,805
Interest Rate
6.87%
Mortgage Type
FHA
Create a Home Valuation Report for This Property
The Home Valuation Report is an in-depth analysis detailing your home's value as well as a comparison with similar homes in the area
Home Values in the Area
Average Home Value in this Area
Purchase History
| Date | Buyer | Sale Price | Title Company |
|---|---|---|---|
| Prybil Donna M | $165,000 | Chicago Title | |
| Dankert Dorothy J | -- | -- | |
| Dankert Richard L | $220,000 | Universal Title Services Inc |
Source: Public Records
Mortgage History
| Date | Status | Borrower | Loan Amount |
|---|---|---|---|
| Open | Prybil Donna M | $132,000 | |
| Previous Owner | Dankert Richard L | $189,805 |
Source: Public Records
Tax History
| Year | Tax Paid | Tax Assessment Tax Assessment Total Assessment is a certain percentage of the fair market value that is determined by local assessors to be the total taxable value of land and additions on the property. | Land | Improvement |
|---|---|---|---|---|
| 2024 | $10,138 | $142,813 | $32,723 | $110,090 |
| 2023 | $9,830 | $127,729 | $29,267 | $98,462 |
| 2022 | $9,057 | $107,664 | $25,942 | $81,722 |
| 2021 | $8,634 | $100,302 | $24,168 | $76,134 |
| 2020 | $8,378 | $96,751 | $23,312 | $73,439 |
| 2019 | $8,209 | $92,602 | $22,312 | $70,290 |
| 2018 | $7,729 | $85,545 | $20,612 | $64,933 |
| 2017 | $7,577 | $80,589 | $19,418 | $61,171 |
| 2016 | $7,519 | $75,585 | $18,212 | $57,373 |
| 2013 | -- | $78,904 | $16,989 | $61,915 |
Source: Public Records
Map
Nearby Homes
- 321 Cold Spring St
- 341 Cold Spring St
- 331 Cold Spring St
- 371 Cold Spring St
- 128 E Main St
- 124 E Main St
- 112 Pearl St
- Lots 2,3,4 Northwest Hwy
- 542 Cary Woods Cir
- 330 Park Ave
- 2016 Grove Ln
- 349 Park Ave
- 603 W Main St
- 582 Arthur Dr
- 258 Stonegate Rd
- 204 Country Commons Rd
- 508 Crest Dr
- 1104 Hillcrest Ave
- 842 Pin Oak Cir
- 208 S River Rd
Your Personal Tour Guide
Ask me questions while you tour the home.