259 W Bakerview Rd Unit C307 Bellingham, WA 98226
Meridian NeighborhoodEstimated Value: $363,000 - $373,000
2
Beds
2
Baths
1,084
Sq Ft
$340/Sq Ft
Est. Value
About This Home
This home is located at 259 W Bakerview Rd Unit C307, Bellingham, WA 98226 and is currently estimated at $369,015, approximately $340 per square foot. 259 W Bakerview Rd Unit C307 is a home located in Whatcom County with nearby schools including Birchwood Elementary School, Shuksan Middle School, and Squalicum High School.
Ownership History
Date
Name
Owned For
Owner Type
Purchase Details
Closed on
Feb 27, 2025
Sold by
Slater Doug
Bought by
Slater Tami
Current Estimated Value
Purchase Details
Closed on
Oct 7, 2010
Sold by
Sw Conix Rainy Llc
Bought by
Slater Doug and Slater Tami
Purchase Details
Closed on
Dec 24, 2009
Sold by
Gemstone Holdings Llc
Bought by
Sw Conix Rainy Llc
Home Financials for this Owner
Home Financials are based on the most recent Mortgage that was taken out on this home.
Original Mortgage
$3,050,000
Interest Rate
4.91%
Mortgage Type
Purchase Money Mortgage
Purchase Details
Closed on
Jul 10, 2009
Sold by
Millennia Development 2000 Llc
Bought by
Gemstone Holdings Two Llc
Create a Home Valuation Report for This Property
The Home Valuation Report is an in-depth analysis detailing your home's value as well as a comparison with similar homes in the area
Home Values in the Area
Average Home Value in this Area
Purchase History
| Date | Buyer | Sale Price | Title Company |
|---|---|---|---|
| Slater Tami | $313 | None Listed On Document | |
| Slater Doug | $165,280 | Chicago Title Insurance | |
| Sw Conix Rainy Llc | $3,050,280 | Stewart Title Company | |
| Gemstone Holdings Two Llc | $6,360,000 | Chicago Title Insurance |
Source: Public Records
Mortgage History
| Date | Status | Borrower | Loan Amount |
|---|---|---|---|
| Previous Owner | Sw Conix Rainy Llc | $3,050,000 |
Source: Public Records
Tax History Compared to Growth
Tax History
| Year | Tax Paid | Tax Assessment Tax Assessment Total Assessment is a certain percentage of the fair market value that is determined by local assessors to be the total taxable value of land and additions on the property. | Land | Improvement |
|---|---|---|---|---|
| 2024 | $2,823 | $362,488 | $34,133 | $328,355 |
| 2023 | $2,823 | $362,488 | $34,133 | $328,355 |
| 2022 | $2,466 | $326,565 | $30,750 | $295,815 |
| 2021 | $2,410 | $265,500 | $25,000 | $240,500 |
| 2020 | $2,298 | $244,901 | $22,645 | $222,256 |
| 2019 | $2,011 | $225,716 | $20,871 | $204,845 |
| 2018 | $2,024 | $197,976 | $18,306 | $179,670 |
| 2017 | $1,771 | $170,383 | $15,755 | $154,628 |
| 2016 | $1,594 | $155,783 | $14,405 | $141,378 |
| 2015 | $1,968 | $146,000 | $13,500 | $132,500 |
| 2014 | -- | $174,406 | $16,384 | $158,022 |
| 2013 | -- | $162,030 | $15,221 | $146,809 |
Source: Public Records
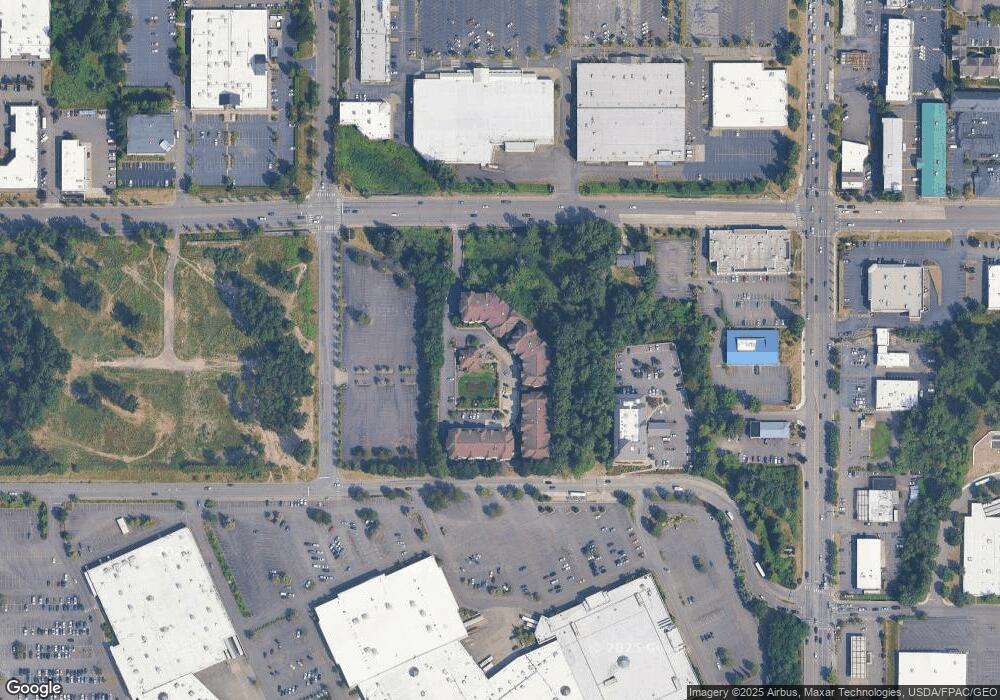
Map
Nearby Homes
- 259 W Bakerview Rd Unit C203
- 251 W Bakerview Rd Unit 103
- 4506 Meridian St
- 3729 Meridian St
- 500 Darby Dr Unit 304
- 500 Darby Dr Unit 210
- 500 Darby Dr Unit 314
- 344 E Bellis Fair Pkwy
- 504 Darby Dr Unit 110
- 512 Darby Dr Unit 213
- 512 Darby Dr Unit 212
- 4015 Eliza Ave Unit 120
- 4015 Eliza Ave Unit 31
- 660 Leroy Place
- 516 Darby Dr Unit 207
- 516 Darby Dr Unit 213
- 516 Darby Dr Unit 104
- 246 Prince Ave Unit 202
- 4121 Village Dr Unit 9
- 617 Sunflower Ln Unit E2
- 259 W Bakerview Rd Unit C408
- 259 W Bakerview Rd Unit C407
- 259 W Bakerview Rd Unit C406
- 259 W Bakerview Rd Unit C405
- 259 W Bakerview Rd Unit C404
- 259 W Bakerview Rd Unit C403
- 259 W Bakerview Rd Unit C309
- 259 W Bakerview Rd Unit C308
- 259 W Bakerview Rd Unit C306
- 259 W Bakerview Rd Unit C305
- 259 W Bakerview Rd Unit C303
- 259 W Bakerview Rd Unit C302
- 259 W Bakerview Rd Unit C301
- 259 W Bakerview Rd Unit C209
- 259 W Bakerview Rd Unit C208
- 259 W Bakerview Rd Unit C207
- 259 W Bakerview Rd Unit C205
- 259 W Bakerview Rd Unit C204
- 259 W Bakerview Rd Unit C202
- 259 W Bakerview Rd Unit C201